Watershed Water Quality Monitoring Project
Appearance

These pages contain material developed by students at Cal Poly Humboldt under supervision by User:Margarita Otero-Diaz.
Research outputs[edit | edit source]

The objective of this project is to assess the water quality health of Martin Slough and Jacoby Creek in Humboldt County for habitat suitability for salmonids.

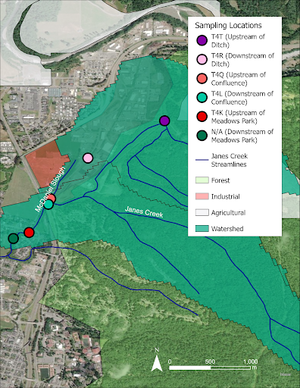
The ditch is a section of Jane’s Creek located along Aldergrove Road in Arcata CA. The area of study for Jane’s Creek located near the ditch was chosen because it is surrounded by industries which could potentially have negative impacts on the water quality.

The portion of Janes Creek assessed within this project is centered around Meadows Park, located on Janes Creek Dr. in Arcata, CA. Figure 3-1 shows the location of both the upstream site, indicated by the red star, and the downstream site, indicated by the green star, which were chosen specifically so that water quality can be assessed with and without the potential influences of Meadows Park and the surrounding residential area. The upstream sampling site, located at (40.88876 N , 124.08242 W), is next to the houses near the roundabout and just before the park. The upstream site is located about 20 feet from Janes Creek Dr. Figure 3-2 and 3-3 show the location of the upstream site. The downstream sampling location is shown in Figure 3-5 and is located at (40.88809 N , 124.08417 W). The downstream site is located under a bridge that crosses Janes Creek, shown in Figure 3-4, where there is what appears to be an old homeless camp located under the bridge, and some litter can be seen both next to the creek and in the creek. Both sampling sites are located near a populated neighborhood, and both are in close proximity to Meadows Park. The likely sources of contaminants in Janes Creek are oil runoff from roads, litter from walkers on the paths/park, litter from drivers, agricultural land, vegetation falling from overhanging trees and brush surrounding the creek, sprinkler runoff from houses, and pet waste. The objective of our project is to assess the impact of Meadows Park and the surrounding residential area on the water quality of Janes Creek and its suitability as habitat for salmonid species by comparing water quality parameters measured upstream and downstream of the influences.
Appendix A. Raw data: The raw data collected from each of our testing locations were recorded in Table A-1 and A-2. The columns represent the parameters that were recorded in the field, as well as in lab experiments such as salinity, turbidity, and TSS. The rows are color coordinated to represent the week of testing done, red for week one, yellow for week two, blue for week three, and green for week four. During week two, the TSS column for both Tables A-1 and A-2 have red highlighted cells to indicate errors made during the TSS experiment. Our team had discussed it was most likely a tabulation error during the initial weighing of the crucible and filter. All values inside of the cells are corrected to the proper decimal place.
Summary tables of water quality parameters analyzed (DO, temperature, conductivity, pH, turbidity, and TSS) and their importance in terms of effects on salmonids. Each table includes information on healthy (or unhealthy) range, species/life-stage, time-duration and effects.