Particle Size Analysis using ImageJ Software:FAST
This page will guide through the process of analyzing particle sizes using ImageJ software. It will output areas of each particle in your image, which can then be processed using other software like excel or Libreoffice.
Setup[edit | edit source]
Helpful video (Made by someone else): https://www.youtube.com/watch?v=JQAZ--c9YfI
1. Items Required:
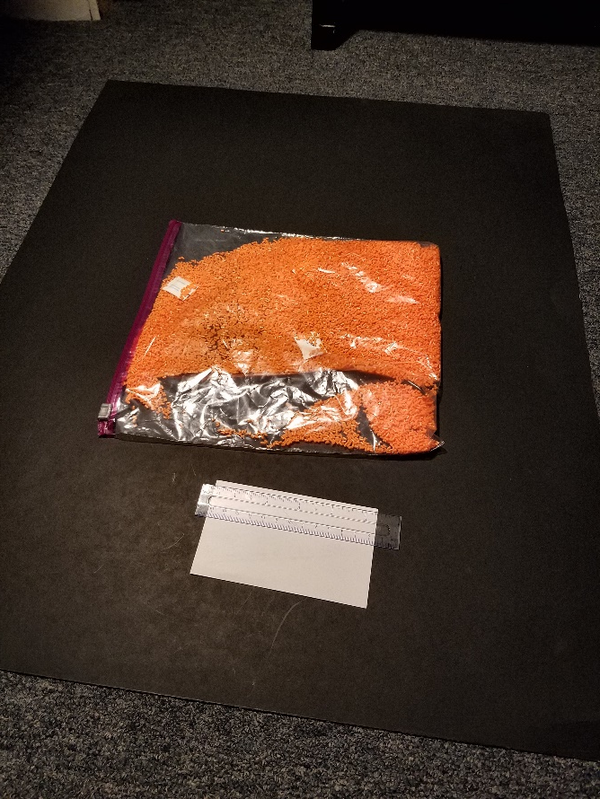
	A. Particles
	B. Ruler (or Scale on Image)
	C. Camera (Cell Phone or Digital) that can take high quality photos
	D. High Contrast Background, either white or black depending on particle color
Installing FIJI (Fiji Is Just ImageJ)[edit | edit source]
Download link: https://fiji.sc/
ImageJ Analysis[edit | edit source]
3. Open the ImageJ Software
4. Open image
E. File > Open > Select Image
5. Save as something memorable
F. File > Save as > “PLA Pellet Distribution 6-1-2018”
6. Set Scale on Image
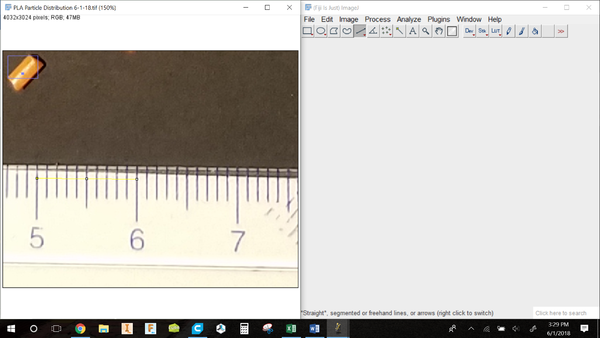
	G. Select Line Tool
	H. Hold control and scroll to zoom
	I. Draw line on ruler a set distance (ex. From 50 to 60mm) – Click and Drag
	J. Go to Analyze > Set Scale
	K. Set known distance and units (ex. 10mm)
	L. Select OK, and your image in now calibrated to scale.
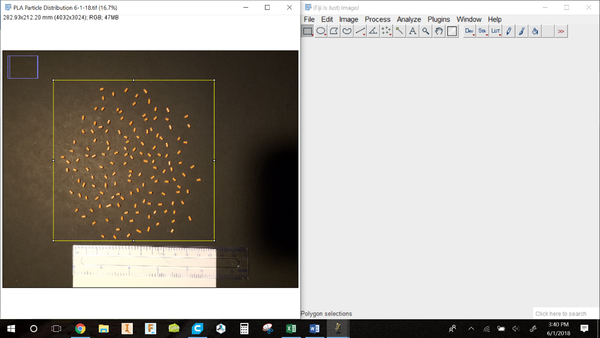
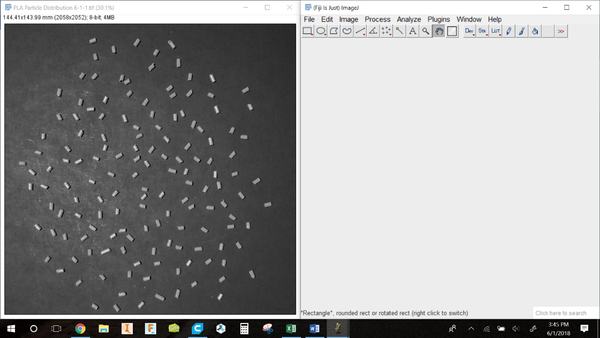
7. Draw Rectangle around particles
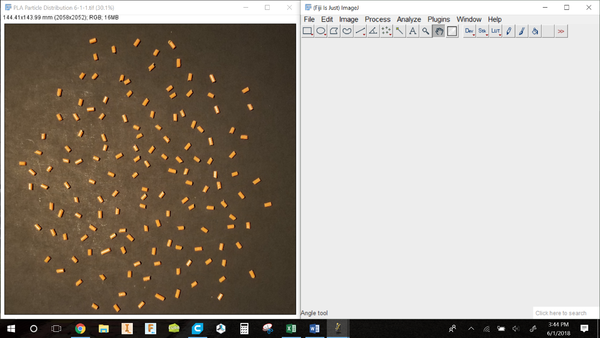
8. Duplicate image by going to Image > Duplicate. It will open a new window with just the particles in the image.
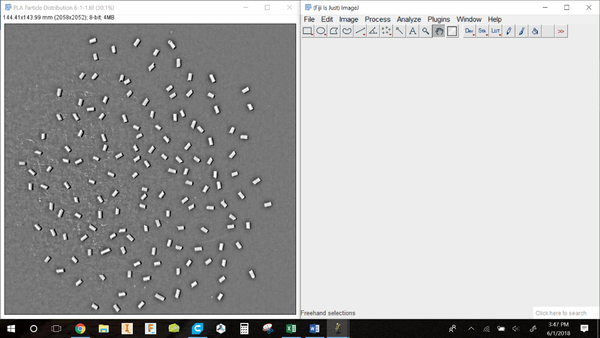
9. Set Image as 8 bit by going Image > Type > 8 Bit
10. Set bandpass filter by going Process > FFT > Bandpass Filter. Hit OK without changing any settings.
11. You are now ready to perform a particle distribution; the previous steps were to get the image ready for analysis.
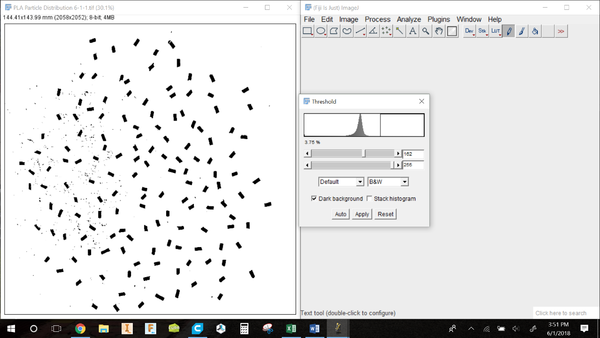
12. Adjust the threshold by going to Image > Adjust > Threshold
13. Move the two bars until you get black where the particles are, and a white background, it is ok if there is specks still showing, we will ignore those in the next steps. Example shown below. Note: If your original image background was white, the Adjustment Threshold background will be black.
14. Hit apply
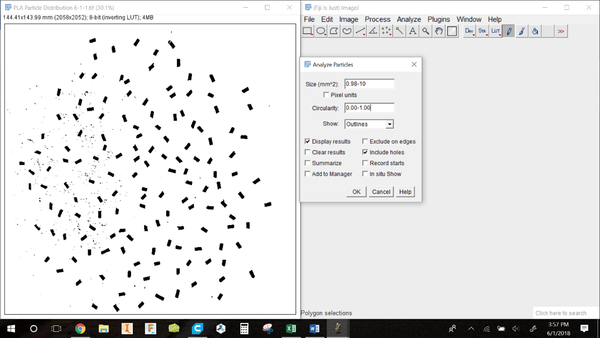
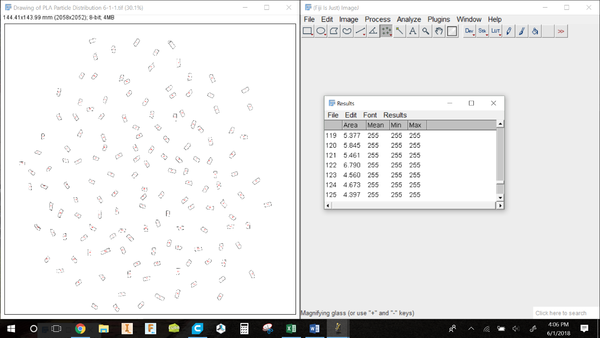
15. Analyze the particle size by going Analyze > Analyze Particles
16. Set size to about the size you would expect, this can be tweaked to make sure that the specks are not being counted. You can also tweak the circularity of the particles as well. Go to Show > Outlines to output a picture of what the software is measuring
17. Check: Display Results and Include holes
18. Results are shown in a new window, as well as the image showing the particles that are actually being measured. Make sure that particles are not being counted as two together, this will skew area results.
19. The results window can be saved to a text document, where they can be formatted and analyzed further.
20. Done!

