HSU straw analysis
This page is the compilation of a research project in partnership between Engr308 Technology and the Environment (taught by Lonny Grafman) and the Cal Poly Humboldt (CPH) Sustainability Office during Fall 2018. The client leads on this project are:
- Megan Tolbert, Waste, Recycling and Grounds Coordinator
- Katie Koscielak, Sustainability Analyst
The objective of this project is to analyze and compare the effects of the impacts of various types of straws based upon their embedded carbon dioxide emissions and embedded energy. A secondary goal is to create a recommendation that would educated future straw policy at CPH. Another goal was to create compelling straw comparisons for consumers. Please note that this comparison does not include other impacts such as plastic waste in the ocean.
Findings[edit | edit source]
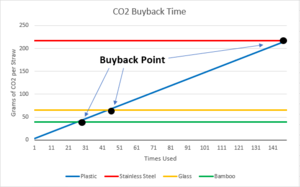
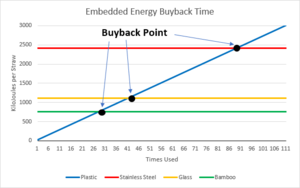
This study of plastic straws, stainless steel straws, glass straws, paper straws, and bamboo straws compared three metrics: carbon dioxide emissions, embedded energy, and cost. It was concluded that the materials used, transport of, and disposal of a single plastic straw requires 27.2 kJ of energy, is responsible for 1.46 grams of carbon dioxide emissions, and are sold for $0.003. In comparison, a single stainless steel straw is responsible for using 2420 kJ of energy, releasing 217 grams of carbon dioxide, and costs $3.00. A single glass straw is responsible for using 1105 kJ of energy, releasing 65.2 grams of carbon dioxide emissions, and costs $0.32. A single paper straw is responsible for using 15.1 kJ of energy, releasing 1.38 grams of carbon dioxide emissions, and costs $0.04. A single bamboo straw is responsible for 754 kJ of energy, releasing 38.8 grams of carbon dioxide emissions, and costs $1.29. In order to abate the embedded energy and carbon dioxide emissions incorporated in a stainless steel straw, glass straw, and bamboo straw, the stainless steel straw must be reused 102 times (energy) and 149 times (carbon dioxide), the glass straw must be reused 45 times to make up for both embedded energy and carbon dioxide, and the bamboo straw must be reused 32 times (energy) and 27 times (carbon dioxide), rather than purchase and dispose of a plastic straw.
| Plastic Straw | Stainless Steel Straw | Glass Straw | Paper Straw | Bamboo Straw | |
|---|---|---|---|---|---|
| Embedded Energy (kJ/straw) | 23.7 | 2420 | 1074 | 16.0 | 756 |
| Carbon Dioxide (gCO2/straw) | 1.46 | 217 | 65.2 | 1.38 | 38.8 |
| Straw Reuses Needed to pay off EE | Disposable | 102 | 45 | Disposable | 32 |
| Straw Reuses Needed to pay off CO2 | Disposable | 149 | 45 | Disposable | 27 |
The calculations and assumptions used to obtain these results can be seen in further detail in the following spreadsheet:
The spreadsheet allows for others interested in performing a similar analysis to easily input values pertaining to their particular study area. It is our hope that with this information and the pre-assembled spreadsheet, other institutions will be able to reach similar compelling conclusions that have the potential to influence future policies.
Plastic Straws[edit | edit source]
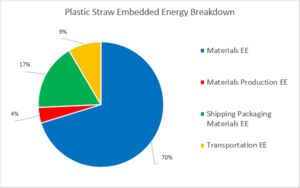
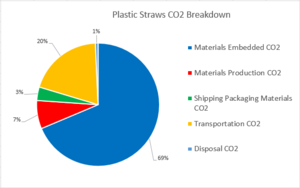
The plastic straws analyzed in this study were the Straight Straws made of polypropylene weighing 0.20 grams. The straws were produced by the company Plastico based out of Surrey, United Kingdoms, and were transported to Cal Poly Humboldt in Arcata, California. The straws are purchased by the pallet for $0.003 per straw. It was estimated that 100% of all the straws purchased were thrown out.
| Output | Embedded Energy | Carbon Dioxide Emissions |
|---|---|---|
| Materials | 20.17 kJ/straw | 1.10 g CO2/straw |
| Transportation | 6.99 kJ/straw | 0.34 g CO2/straw |
| Disposal | 0.02 kJ/straw | 0.01 g CO2/straw |
| Total | 27.18 kJ/straw | 1.45 g CO2/straw |
Stainless Steel Straws[edit | edit source]
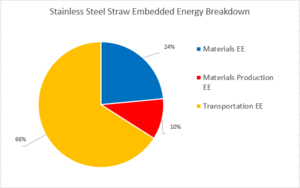
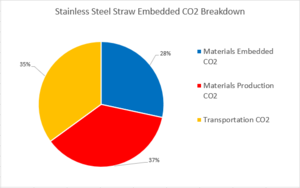
The stainless steel straws analyzed in this study were the Stainless Steel Drinking Straws weighing 10 grams. These straws were produced by the company Santi Sora based out of Guangdong, China, and were transported to Cal Poly Humboldt in Arcata, California. The straws are purchased by the pallet for $0.26 per straw. It was estimated that 3% of all the stainless steel straws purchased were thrown out within 5 years of acquiring the straw.
| Output | Embedded Energy | Carbon Dioxide Emissions |
|---|---|---|
| Materials | 820.00 kJ/straw | 140.91 g CO2/straw |
| Transportation | 1598.92 kJ/straw | 76.24 g CO2/straw |
| Disposal | 0.02 kJ/straw | 0.02 g CO2/straw |
| Total | 2418.94 kJ/straw | 217.16 g CO2/straw |
Glass Straws[edit | edit source]
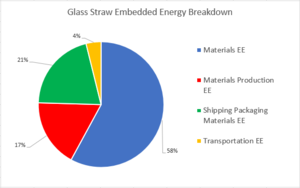
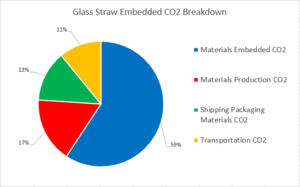
The glass straws analyzed in this study were the 8" Simple Elegance straws weighing 21.3 grams. These straws were produced by the company Glass Dharma based out of Fort Bragg, California, and were transported to Cal Poly Humboldt in Arcata, California. The straws are sold by the four pack for $7.99 per straw. It was estimated that 10% of all the glass straws purchased were recycled within 5 years of acquiring the straw.
| Output | Embedded Energy | Carbon Dioxide Emissions |
|---|---|---|
| Materials | 834.06 kJ/straw | 49.29 g CO2/straw |
| Transportation | 271.32 kJ/straw | 15.78 g CO2/straw |
| Disposal | 0.50 kJ/straw | 0.08 g CO2/straw |
| Total | 1105.88 kJ/straw | 65.15 g CO2/straw |
Paper Straws[edit | edit source]
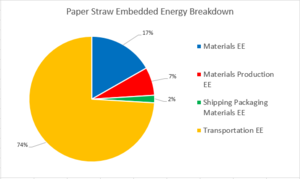
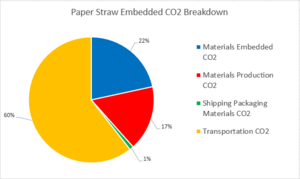
The paper straws analyzed in this study were the 7.75" White Jumbo Paper straws weighing 0.20 grams. These straws were produced by the company Aardvark Straws based out of Fremont, California, and were transported to Cal Poly Humboldt in Arcata, California. The straws are purchased by the case for $0.04 per straw. It was estimated that 100% of all the paper straws purchased were thrown out.
| Output | Embedded Energy | Carbon Dioxide Emissions |
|---|---|---|
| Materials | 3.61 kJ/straw | 0.53 g CO2/straw |
| Transportation | 11.43 kJ/straw | 0.85 g CO2/straw |
| Disposal | 0.01 kJ/straw | 0.01 g CO2/straw |
| Total | 15.05 kJ/straw | 1.38 g CO2/straw |
Bamboo Straws[edit | edit source]
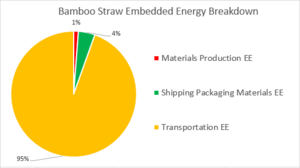
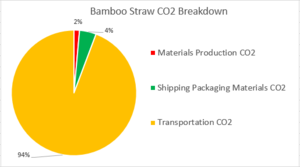
The bamboo straws analyzed in this study were the 8.9" Bamboo straws weighing 3.6 grams. The straws were produced by the company Bali Boo based out of Bali, Indonesia, and were transported to Cal Poly Humboldt in Arcata, California. The straws are purchased by the 100 for $1.29 per straw. It was estimated that 25% of all the bamboo straws purchased were composted and 25% were thrown out within 5 years of acquiring.
| Output | Embedded Energy | Carbon Dioxide Emissions |
|---|---|---|
| Materials | 9.10 kJ/straw | 0.55 g CO2/straw |
| Transportation | 745.23 kJ/straw | 38.27 g CO2/straw |
| Disposal | 0.07 kJ/straw | 0.05 g CO2/straw |
| Total | 754.41 kJ/straw | 38.87 g CO2/straw |
Impacts[edit | edit source]
Based off the calculations made above for the embedded energy, CO2 emissions, and costs relating to each straw type, various impacts on the CPH campus can be made. On a typical work day at CPH (Monday through Friday), it can be assumed that 1,000 straws will be used per day.
Given that there are 146 school-days in a year, the impacts of plastic vs paper straws can be calculated below to compare the impact of switching to a biodegradable single-use option.
| Total Sold | Embedded Energy | CO2 Emissions | |
|---|---|---|---|
| Plastic Straws | 146,000 straws | 3,968 MJ | 211,700 g |
| Paper Straws | 146,000 straws | 2,197 MJ | 201,480 g |
Alternatively, if reusable straws were to be provided to every incoming year of students, you could assume that the waste and emissions from the disposable straw types would be eliminated. To compare the impact of every incoming student being given a reusable straw to replace the single-use straws provided:
- Assume 3,500 new students per year
| Total Given | Embedded Energy | CO2 Emissions | |
|---|---|---|---|
| Stainless Steel Straws | 3,500 straws | 8,466 MJ | 760,095 g |
| Glass Straws | 3,500 straws | 3,869 MJ | 228,130 g |
| Bamboo Straws | 3,500 straws | 2,640 MJ | 136,045 g |
See below the comparison of the carbon dioxide and embedded energy impacts of giving every incoming CPH student a reusable straw in replacement of the 1,000 plastic straws used per day.
| Total Saved | Embedded Energy Savings | CO2 Emissions Avoided | |
|---|---|---|---|
| Stainless Steel Straws | 3,500 straws | ||
| Glass Straws | 3,500 straws | 99 MJ | |
| Bamboo Straws | 3,500 straws | 1,328 MJ | 75,655 g |
As you can see above, there is actually a negative impact when considering eliminating plastic straws available on campus and substituting giving every incoming student either a stainless steel or glass straw. The stainless steel straw has a higher impact in regards to both energy and carbon dioxide, and therefore would be a less favorable solution. The glass straws have a positive impact in energy, but the carbon dioxide emissions are still greater than providing plastic straws. The bamboo straws are the best alternative option available to the CPH faculty in considering replacing single-use plastic straws with giving away bamboo straws. It is also important to consider the amount of energy and carbon dioxide that is attributed to the transportation for the bamboo straw that was chosen for this comparison, as it is coming from outside of the country. If a more local distributor were selected for this comparison there would likely be a more significant difference in the energy and carbon dioxide amounts for bamboo straws.
| Total Given Each Year | Cost | Difference from Plastic Straws | |
|---|---|---|---|
| Stainless Steel Straws | 3,500 straws | $910.00 | $-524.00 |
| Glass Straws | 3,500 straws | $27,965.00 | $-27,579.00 |
| Bamboo Straws | 3,500 straws | $4,515.00 | $-4,129.00 |
The cost analysis shows that none of the reusable straw options are cost effective for the CPH campus, but it is important to consider the price changes when ordering in larger quantities. For comparison, the price per plastic straw is relative to an order of 12,000 straws, the price per stainless steel straw is relative to an order of 1,000 straws, the price per glass straw is relative to an order of 4 straws, and the price per bamboo straw is relative to an order of 100 straws.
Next Steps[edit | edit source]
After completing the initial analysis, there are various alterations to the methods that could be made to create even more accurate results. These include:
- What are people's methods of washing the straws? Is it significant enough to change the final outputs?
- How often are straws actually reused compared to the number that are purchased simply due to the lower price?
- Determine the volume of waste avoided by the implementation of a policy such as this.
- Calculate the embedded energy and carbon dioxide emissions in each unit produced by the manufacturing facilities, and the acquisition of the raw materials.
- Explore alternate options as to whether or not other viable products have the potential to reduce the embedded energy or carbon dioxide emissions from any of the straws.
- Outlets for promoting and distributing this research to make it widely accessible.
- Partnership with other CSUs to strive towards waste, energy, and CO2 reduction initiatives.
Media[edit | edit source]
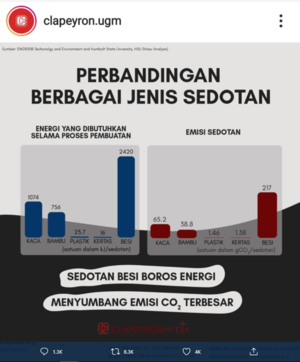
This study has been shared thousands of times and reported on in numerous countries.