
This page is the beginnings of a portal for California community action in response to Ecological emergency. The majority of our information about this is collated via our place pages ...Near you. Please see Ecological restoration for a topic overview.
Community action projects[edit | edit source]
Ecosystem restoration[edit | edit source]

 How China’s most ‘futuristic’ city restored its mangroves, dialogue.earth (Jul 11, 2024)
 - Community-led approach to mangrove restoration in southern Thailand based on beekeeping, news.mongabay.com (Jun 18, 2024)
- EU passes law to restore 20% of bloc’s land and sea by end of decade, theguardian.com (Jun 17, 2024)
Ecosystem restoration is the process of halting and overturning degradation, resulting in cleaner air and water, extreme weather mitigation, better human health, and recovered biodiversity, including improved pollination of plants. Restoration encompasses a wide continuum of practices, from reforestation to re-wetting peatlands and coral rehabilitation.[1]
Citizen Science[edit | edit source]
Citizen Science refers to the involvement, participation and engagement of citizens in local or online (global) scientific work relevant to the citizens' interests, usually as a hobby, often as a passion.
Near you[edit | edit source]

A saltwater marsh is a specific ecosystem with benefits to humans and the environment. A low-lying, nearly level coastal grassland governed by the seasons and the tides, saltwater marshes are one of the most productive areas in the world. They are found on the edges of estuaries which, unlike swamps, are more shallow. Estuaries are the places where rivers meet oceans, and are enjoyed by people for homes, fishing, hunting, swimming, and for wildlife observation. Saltwater marshes have the benefits of filtering estuary water of sediment and toxins and acting as storm surge protection for more diverse upland regions.[2][3]
Arcata's saltwater marshes have been restored so they are not naturally-occurring. However, Arcata's saltwater marsh does contain typical grasses and organisms. Also typical is this ecosystems original destruction by human settlement. Unlike many saltwater marshes, the Arcata/Eureka saltwater marshes aren't used as protection for the inland areas from storm surges because of the protection provided by Humboldt Bay.[4]
News and comment[edit | edit source]
2021
The Healing Work of Returning Stolen Lands, PennElys Droz, Nov 15[5]
Biodiversity[edit | edit source]
The ecology of California can be understood by dividing the state into a number of ecoregions, which contain distinct ecological communities of plants and animals in a contiguous region. The ecoregions of California can be grouped into four major groups: desert ecoregions (such as the Mojave Desert), Mediterranean ecoregions (such as the Central Valley), forested mountains (such as the Sierra Nevada), and coastal forests.
- Redwood Coast Land Conservancy, 501(c)(3) California non-profit organization founded in 1992, preserving the natural coastal landscapes and wildlife habitats of southern Mendocino and northern Sonoma counties for the benefit of our community and future generations. added 12:33, 25 January 2024 (UTC)
Deserts[edit | edit source]
The ecology of California can be understood by dividing the state into a number of ecoregions, which contain distinct ecological communities of plants and animals in a contiguous region. The ecoregions of California can be grouped into four major groups: desert ecoregions (such as the Mojave Desert), Mediterranean ecoregions (such as the Central Valley), forested mountains (such as the Sierra Nevada), and coastal forests.
Different authorities define the boundaries of ecoregions somewhat differently: this article follows the definitions of the World Wide Fund for Nature (WWF) and the United States Environmental Protection Agency (EPA)
Mediterranean ecoregions[edit | edit source]
The ecology of California can be understood by dividing the state into a number of ecoregions, which contain distinct ecological communities of plants and animals in a contiguous region. The ecoregions of California can be grouped into four major groups: desert ecoregions (such as the Mojave Desert), Mediterranean ecoregions (such as the Central Valley), forested mountains (such as the Sierra Nevada), and coastal forests.
Different authorities define the boundaries of ecoregions somewhat differently: this article follows the definitions of the World Wide Fund for Nature (WWF) and the United States Environmental Protection Agency (EPA)
California's high mountains block most moisture from reaching the eastern parts of the state, which are home to California's desert and xeric shrub ecoregions. The low desert of southeastern California is part of the Sonoran desert ecoregion, which extends into Arizona and parts of northern Mexico. California has two high deserts: the Mojave desert and the Great Basin Desert. The Mojave desert ecoregion is marked by the presence of Joshua trees. The dry cold Great Basin desert of California consists of the Owens Valley, and is classified into Great Basin shrub steppe by the WWF, and into the Central Basin and Range ecoregion by the EPA.
The deserts in California receive between 2 and 10 inches (51 and 254 mm) of rain per year. Plants in these deserts are brush and scrub, adapted to the low rainfall. Common plant species include creosote bush, blackbrush, greasewood, saltbush, big sagebrush, low sagebrush, and shadscale. Higher elevations have more precipitation, which allows drought-resistant trees to grow, such as western juniper and pinyon pine.
The coast of California from Monterey Bay south to the Mexican border, and inland from San Francisco Bay Area to the Sierra Nevada foothills contain California's Mediterranean ecoregions. This region is divided by the WWF into three California chaparral and woodlands ecoregions, plus the Central Valley grasslands. The EPA divides the region between the Central Valley (ecoregion 7), the Southern California chaparral (ecoregion 6), the Southern California mountains (ecoregion 8), and the Southern California coast (ecoregion 85).
The WWF distinguishes between different chaparral ecoregions based on species endemism. In the south, the California coastal sage and chaparral extends across the Mexican border into northwestern Baja California and Los Angeles. The coastal sage ecoregion is notable for having the highest number of native bees in the United States, although much of the ecoregion is now urbanized. The California montane chaparral and woodlands include the Transverse Ranges north of Los Angeles as well as the Santa Lucia Range on the Central Coast. The montane chaparral consists of a mosaic of sage scrub, chaparral, and montane species, depending on altitude. The California interior chaparral and woodlands form a ring around the Central Valley, covering the hills around the Bay Area as well as the foothills of the Sierra Nevada. The interior woodland ecoregion contains several endemic species, due to unique soil types such as serpentine.
These chaparral ecoregions contain numerous plant communities, including oak savanna, oak woodland, conifer woodlands, chamise chaparral, coastal sage scrub, and coastal grassland. These plant communities often occur as a mosaic, caused by fire.
California's Central Valley was once a large temperate grassland containing native bunchgrasses and vernal pools. Grizzly bear, gray wolf, tule elk, and pronghorn antelope used to inhabit the grasslands. The native grasslands and pools have now been largely replaced by livestock ranches and farms. The Carrizo Plain, where the native grass is preserved, is referred to as the "Serengeti of California".
The cooler and wetter mountains of northern California are covered by forest ecoregions. Both the WWF and the EPA divide the mountains into three ecoregions: the Sierra Nevada, the Klamath Mountains, and the Eastern Cascades Slopes and Foothills (occurring on the Modoc Plateau).
The Sierra Nevada are home to half of the vascular plant species of California, with 400 species that are endemic to the region. Like many mountain ranges, the plant communities of the Sierra group into biotic zones by altitude, because of the increasingly harsh climate as elevation increases. These biotic zones include montane forest dominated by conifers such as Jeffrey pine and Lodgepole pine, subalpine forest dominated by whitebark pine, up to alpine tundra which cannot support trees. The Sierra are also notable for giant sequoia trees: the most massive on earth.
The Klamath and Siskiyou Mountains are a notable biodiversity hotspot, containing one of the four most biodiverse temperate forests in the world. The diversity is caused by the ecoregion being adjacent to a number of other ecoregions, diverse soil, and having refugia caused by isolation in the last ice age. Some endemic species in the Klamath mountains are limited to only one mountain or valley.
The Eastern Cascades slopes of the Modoc Plateau are characterized by a mosaic of open ponderosa pine forest, grasslands, and shrublands. Although high, these slopes and mountains are in the rain shadow of the Cascade Range, and hence are drier and more open.
The coast of California north of San Francisco contains the Northern California coastal forests (as defined by the WWF) and the southern section of the Coast Range ecoregion (as defined by the EPA). This ecoregion is dominated by redwood forest, containing the tallest and some of the oldest trees in the world.
The redwood forests thrive in a thin belt up to 35 miles (56 km) wide next to the coast, where the trees are kept moist by winter rains and summer fog. The redwood forests are also notable for having the highest forest productivity in the world.
see also: Trees, woodland and forest
Environment quality[edit | edit source]
Pollution in California[edit | edit source]
Pollution in California relates to the degree of pollution in the air, water, and land of the U.S. state of California. Pollution is defined as the addition of any substance (solid, liquid, or gas) or any form of energy (such as heat, sound, or radioactivity) to the environment at a faster rate than it can be dispersed, diluted, decomposed, recycled, or stored in some harmless form. The combination of three main factors is the cause of notable unhealthy levels of air pollution in California: the activities of over 39 million people, a mountainous terrain that traps pollution, and a warm climate that helps form ozone and other pollutants. Eight of the ten cities in the US with the highest year-round concentration of particulate matter between 2013 and 2015 were in California, and seven out of the ten cities in the US with the worst ozone pollution were also in California. Studies show that pollutants prevalent in California are linked to several health issues, including asthma, lung cancer, birth complications, and premature death. In 2016, Bakersfield, California recorded the highest level of airborne pollutants of any city in the United States.
The Federal Clean Water Act defines water pollution as "dredge spoil, solid waste, incinerator residue, sewage, garbage, sewage sludge, munitions, chemical wastes, biological materials, heat, wrecked or discarded equipment, rock, sand, cellar dirt, and industrial, municipal, and agricultural waste discharged into water." In 2011, an Environmental Protection Agency (EPA) study showed that water quality standards were not met on 1.6 million acres of California's 3 million acres of lakes, bays, wetlands, and estuaries. The Porter-Cologne Water Quality Control Act governs the water quality regulation in California.
Water purity[edit | edit source]
California's interconnected water system serves almost 40 million people and irrigates over 5,680,000 acres (2,300,000 ha) of farmland. As the world's largest, most productive, and potentially most controversial water system, it manages over 40 million acre-feet (49 km3) of water per year. Use of available water averages 50% environmental, 40% agricultural and 10% urban, though this varies considerably by region and between wet and dry years. In wet years, "environmental" water averages 61%, while in dry years it averages 41%, and can be even lower in critically dry years.
Water and water rights are among the state's divisive political issues. Due to the lack of reliable dry season rainfall, water is limited in the most populous U.S. state. An ongoing debate is whether the state should increase the redistribution of water to its large agricultural and urban sectors, or increase conservation and preserve the natural ecosystems of the water sources.
California's limited water supply comes from two main sources: surface water, or water that travels or gathers on the ground, like rivers, streams, and lakes; and groundwater, which is water that is pumped out from the ground. California has also begun producing a small amount of desalinated water, water that was once sea water, but has been purified.
Groundwater is a critical element of the California water supply. During a normal year, 30% of the state's water supply comes from groundwater (underground water). In times of intense drought, groundwater consumption can rise to 60% or more. Over 850,000,000 acre-feet (1,050 km3) of water is stored in California's 450 known groundwater reservoirs. However, not all the water is usable. Over half of the groundwater is unavailable due to poor quality and the high cost of pumping the water from the ground. While surface water is concentrated mostly in the northern part of the state, groundwater is more evenly distributed.
The largest groundwater reservoirs are found in the Central Valley. The majority of the supply there is in the form of runoff that seeps into the aquifer. The freshwater is usually found in deposits of gravel, silt, and sand. Below these deposits lies a layer of deep sediment, a relic of the era when the Pacific Ocean covered the area.
In 2014, the Sustainable Groundwater Management Act was introduced to regulate usage of groundwater sources statewide. This legislation regulates management of groundwater through local agencies in their own respective groundwater basin regions. Groundwater sustainability agencies are created by the legislation, and they are required to develop groundwater sustainability plans that control overdraft and recharge. California's groundwater is also overseen by the Groundwater Ambient Monitoring and Assessment Program, which evaluates groundwater quality and contamination across the state under the direction of the California State Water Resources Control Board.
The large quantity of water beneath the surface has given rise to the misconception that groundwater is a sort of renewable resource that can be limitlessly tapped. Calculations assuming that groundwater usage is sustainable if the rate of removal equals the rate of recharge are often incorrect as a result of ignoring changes in water consumption and water renewal.
While the volume of groundwater in California is very large, aquifers can be over drafted when groundwater is removed more rapidly than it is replenished. In 1999, it was estimated that the average, annual overdrafting was around 2,200,000 acre-feet (2.7 km3) across the state, with 800,000 acre-feet (0.99 km3) in the Central Valley. Since then, overdrafting had significantly increased. Satellite measurements found that in just the combined Sacramento and San Joaquin River basins, including the Central Valley, overdrafting between 2011 and 2014 was 12,000,000 acre-feet (15 km3) of water per year.
California has ten major drainage basins defined for convenience of water management. These basins are divided from one another by the crests of mountains. From north to south the basins are: North Coast, Sacramento River, North Lahontan, San Francisco Bay, San Joaquin River, Central Coast, Tulare Lake, South Lahontan, South Coast, and Colorado River regions. Each region incorporates watersheds from many rivers of similar clime. Many of the drainage basins are extremely altered, with hydroelectric power generation happening in much of the upper portion of these watersheds.
The Central Valley watershed, which incorporates the Sacramento River, San Joaquin River and Tulare Lake regions, is the largest in California, draining over a third of the state – 60,000 square miles (160,000 km2) – and producing nearly half the total runoff. The Sierra Nevada snowpack feeds Central Valley river systems and is a critical source of water in the state's long dry season when little if any precipitation falls. Up to 30 percent of California's water supply is from snowpack, and the majority of California's hydroelectricity is also generated from the Sierra Nevada snowpack. More generally, in the US one of the largest uses of fresh water is withdrawals for the energy sector. Much of California's extensive reservoir and aqueduct system is designed to store and capture runoff from the Central Valley watershed. As this infrastructure ages, dam removal in California has become more widespread--a process that has been largely successful. The Sacramento and San Joaquin Rivers converge at the Sacramento–San Joaquin River Delta, a large fresh-water estuary where much of the state's water supply is withdrawn. The Central Valley watershed provides most of the water for Northern and Central California, as well as a significant chunk of Southern California's usage.
The North Coast watershed receives the highest annual precipitation of any California watershed. It incorporates many large river systems such as the Klamath, Smith, Trinity, and Eel, and produces over a third of the runoff in the state. With the notable exceptions of the Trinity Dam complex that transfers water from the Trinity River into the Sacramento River and Scott Dam that transfers water from the Eel River into the Russian River, most of the North Coast watersheds are relatively undeveloped, some have federal Wild and Scenic status that protect them from development; the northern coastal rivers provide water for salmonid habitat, carbon-sequestering forests, and local communities; some are within the influence of tribal water and fishing rights. Water flowing in these watersheds and into the Pacific Ocean is critical for sensitive, threatened, and endangered salmonids. There have been proposals to create additional inter-basin transfers from North Coast rivers to increase water supplies in the rest of California, but these projects have been rejected due to presumed environmental harm.
The Colorado River originates more than 1,000 miles (1,600 km) from California in the Rocky Mountains of Colorado and Wyoming and forms the state's southeastern border in the Mojave Desert. Unlike the other California watersheds, essentially all of the water flowing in the Colorado originates outside the state. The Colorado is a critical source of irrigation and urban water for southern California, providing between 55 and 65 percent of the total supply.
The Central and South Coast watersheds include the most populous regions of California – the San Francisco Bay Area, Los Angeles and San Diego – but have relatively little natural runoff, requiring the importation of water from other parts of the state.
Rivers of the Lahontan watersheds in eastern California are part of the high desert Great Basin and do not drain to the Pacific. Most of the water is used locally in eastern California and western Nevada for irrigation. The Owens River of the South Lahontan region, however, is a principal source of water for Los Angeles.
Rain typically falls in California only during the winter and spring months, from October through May, with more rain falling on the northern half of the state than the southern. Approximately 75 percent of the total precipitation volume occurs north of Sacramento, while 75 percent of the total water demand is in the south. With very rare exceptions, summers are dry throughout the state. Precipitation falling as snow in the Sierra and other mountain ranges feeds the network of reservoirs and surface water sources that supply the state; a low rainfall or light snowfall year can result in drought.
Rivers in northern and coastal California are mainly rain fed, peaking from January to April and falling to very low levels between June and November. Snowmelt has a significant influence on the Sierra Nevada rivers from east of Sacramento to east of Bakersfield, which typically peak between April and July. Snowmelt is also the primary water source for the Colorado River which supplies southern California.
Annual precipitation in California is highly variable, with a statewide average of 22.9 inches (58.2 cm) of precipitation per year. However, recorded precipitation totals can fluctuate heavily from year to year because of atmospheric conditions and climate change. El Niño–Southern Oscillation often has a significant effect on the state's precipitation, with generally higher precipitation during El Niño periods. In addition, climate change has impacted California's precipitation patterns in recent years with effects including more rapid snowmelt, more frequent heatwaves, and drier conditions across the state.
California precipitation and snowpack is measured by the state of California by "water year", which runs from October 1 to September 30.
In response to water shortages in the state, some water districts are looking to desalination as a way to provide water for residents. Supporters view seawater desalination as a more reliable water source, since it draws its water from the ocean and thus, is not affected by periods of drought like other sources of water are. Another incentive for desalination is the ability for localities to be more self-sufficient with their water supply, thus improving their drought resilience. However, desalination has been the subject of scrutiny by opponents, who believe that the costs and possible environmental effects of desalination are indicators that California should continue to pursue other alternatives.
Although the response to desalination has been mixed, some areas of California are moving forward with seawater desalination. In December 2015, Poseidon Water completed the construction of the Claude "Bud" Lewis Carlsbad Desalination Plant. This facility, which was approved by the San Diego Water Authority, is responsible for providing water for about 8% of San Diego County's water by the year 2020. The facility cost $1 billion to build and is the largest desalination facility in the Western Hemisphere producing up to 50 million gallons (190,000 m3) of water per day. As of December 2015, there are 6 additional seawater desalination plants currently in operation in the state of California. As of May 2016, there are also 9 more proposed desalination plants.
Water reuse in California is increasingly important, with reclaimed water being used preferably for agricultural irrigation, toilet flushing, and industry (e.g., making concrete, cooling), although some apply direct and indirect potable reuse, risking environmental persistent pharmaceutical pollutants and other constituents of emerging concern. Treatment should be in accordance with the use and, in many cases, water can be safely and productively recycled back to the same non-potable use.
Water use in California is divided into approximately 50% for environmental uses, 40% agricultural use and 10% urban uses, though that varies considerably between regions and between wet and dry years. About 63% of the water counted as "environmental" flows down Wild and Scenic Rivers in the North Coast where there is no practical way to recover it for either agricultural or urban use because it lacks many connections to the statewide water supply system. The water flow required to prevent salty water from the Pacific Ocean from intruding into the Delta is counted as "environmental water," though without that flow "reduced water quality resulting from large amounts of salt water drawn into the Delta could shut down the export pumps that supply fresh water to agriculture and cities."
Around 75% of California's water supply comes from north of Sacramento, while 80% of the water demand occurs in the southern two-thirds of the state. The Sacramento–San Joaquin River Delta receives about 40% of California's total precipitation and 50% of its total streamflow. The delta is used by the federal Central Valley Project (CVP) to supply water to the Central Valley and by the California State Water Project (SWP) to supply water to the San Francisco Bay Area, the Central Valley, and Southern California. In a typical year, about 10.8 million acre-feet (13.3 km3) are exported from the delta: 67% by the CVP, 26% by the SWP, and the remaining 7% to other federal water project users. Those flows are greatly reduced in drought years. About 16.5 million acre-feet (20.4 km3) of water entering the Delta in a typical year flows through the Delta into San Francisco Bay, including 6.3 million acre-feet (7.8 km3) in governmentally mandated environmental flows; 22.4 million acre-feet (27.6 km3) is used for other environmental purposes, and 1.6 million acre-feet (2.0 km3) supplies water to managed wetlands and wildlife preserves.
In an average year, about 39% of California's water consumption, or 34.1 million acre-feet (42.1 km3), is used for agricultural purposes. Of that total, 11%, or 8.9 million acre-feet (11.0 km3) is not consumed by the farms for crop production but is instead recycled and reused by other water users, including environmental use, urban use, and agricultural use, yielding net water consumption for food and fiber production equal to 28% of California's water consumption, or 25.2 million acre-feet (31.1 km3). This water irrigates almost 29 million acres (120,000 km2), which grows 350 different crops. Agricultural water usage varies depending on the amount of rainfall each year.
As of 2014, alfalfa uses about 18% of California irrigation water and produces 4% of California's farm-gate revenue, most of which is used as livestock feed. In 2015, California exported one-fourth of its total alfalfa production of roughly 2 million tons. About one-third of that, around 700,000 tons, went to China, Japan took about the same amount and Saudi Arabia bought 5,000 tons. Alfalfa farmers pay about $70 per acre-foot ($0.057/m3), in Los Angeles that same amount of water is worth $1,000 per acre-foot ($0.81/m3). In 2012, California exported 575,000 tons of alfalfa to China, for $586 million. Other common crop water use, if using all irrigated water: fruits and nuts with 34% of water use and 45% of revenue, field crops with 14% of water and 4% of revenue, pasture forage with 11% of water use and 1% of revenue, rice with 8% of water use and 2% of revenue (despite its lack of water, California grows nearly 5 billion pounds (2.3 million metric tons) of rice per year, and is the second largest rice-growing state), and truck farming of vegetables and nursery crops with 4% of water use and 42% of revenue; head of broccoli: 5.4 gallons; one walnut: 4.9 gallons; head of lettuce: 3.5 gallons; one tomato: 3.3 gallons; one almond 1.1 gallon; one pistachio: 0.75 gallon; one strawberry 0.4 gallon; one grape: 0.3 gallon.
Horses, based on the amount of alfalfa they eat, use about 1.9 million acre-feet (2.3 km3) of water – about 7% of irrigated water in the state. There are 698,000 horses in California.
California is one of the top five states in water use for livestock. Water withdrawals for livestock use in California were 101 to 250 million US gallons (380,000 to 950,000 m3) per day in 2010.
Urban and industrial use of water consumes about 11%, or 8.9 million acre-feet (11.0 km3), of total water consumption in an average year. A 2011 study of a sampling of 735 California homes across ten water districts found that the weighted average annual total water use of these homes was 132,000 US gallons (500 m3) per year or 362 US gallons (1.37 m3) per household per day. The study found that about 53% of total average household water use, or more than 192 US gallons (0.73 m3) per household per day, was used for landscaping and other outdoor uses. Meanwhile, indoor use accounted for more than 170 US gallons (0.64 m3) per household per day. The most in-home water consumption is toilet flushes, using 20% of the water. After toilets, 20% is used for showers and 18% goes to leaks inside homes.
In Sacramento, in 2012 before the severe drought started, residents were using 217 US gallons (0.82 m3) a day per-capita. Many homes in Sacramento didn't have water meters until recently. They now are gradually being installed after former Gov. Arnold Schwarzenegger signed a 2004 law mandating meters statewide by 2025.
After Folsom, a city of 72,000 east of Sacramento, installed meters in 2011 and adopted tiered rates that charge more for people who consume the most water, per-capita use started falling steadily.
In response to the severe California drought, in April 2015, Governor Jerry Brown issued an executive order mandating statewide reductions in water use. The mandate aimed to reduce the amount of water consumed statewide in urban areas by 25% from 2013 levels. The State Water Resources Control Board (SWRCB) proposed regulatory instructions that grouped urban water utilities into nine tiers, with conservation standards ranging from 8% to 36%.
There are six main systems of aqueducts and infrastructure that redistribute and transport water in California: the State Water Project, the Central Valley Project, several Colorado River delivery systems, the Los Angeles Aqueduct, the Tuolumne River/Hetch Hetchy system, and the Mokelumne Aqueduct.
The California State Water Project is the largest multipurpose, state-built water project in the United States. The SWP transports water from the Feather River watershed to agriculture, and some of the water goes to industrial and urban users. More than two-thirds of Californians receive some water from the SWP. The system was designed and contracted to deliver 4.2 million acre-feet (5.2 km3), but in an average year delivers only 2.3 million acre-feet (2.8 km3) because many of the original planned features were never built.Twenty-nine agencies hold contracts for SWP water. The contractors pay for SWP's major operating costs and have gradually reduced the $1.75 billion bond debt that supplied funds for initial construction. In the years since 1960, SWP has built 29 dams, 18 pumping plants, five hydroelectric power plants, and around 600 miles (970 km) of canals and pipelines.
The SWP system begins with reservoirs on upper tributaries of the Feather River. Oroville Dam creates the largest SWP reservoir. At 770 feet (230 m) above the riverbed, the dam is the tallest in the United States. The reservoir covers 15,000 acres (61 km2) and holds 3.5 million acre-feet (4.3 km3).Water travels from Lake Oroville to the Sacramento River. At Harvey O. Banks Delta Pumping Plant, which pulls SWP water into the Bethany Reservoir, around 2.2 million acre-feet (2.7 km3) are extracted from the Delta each year.Water that flows to the south end of the San Joaquin Valley must be pumped over the Tehachapi Mountains. Because of this, the SWP is California's largest energy consumer, and even though the hydroelectric plants of the SWP generate 5,900 GWh per year, that is only a fraction of the energy needed to lift water over the Tehachapis.Below the Tehachapis the California Aqueduct splits, with the west branch storing water in Castaic and Pyramid Lake, and the east branch storing water in the Silverwood Lake reservoir.
The CVP's original purpose was to tame seasonal flooding and to direct water to the south to irrigate 3 million acres (12,000 km2) of farmland. The CVP is operated by the United States Bureau of Reclamation. As one of the largest water systems in the world it stores over 7 million acre-feet (8.6 km3) of water, or 17 percent of the state's developed water. The CVP dams and diverts five major rivers: the Trinity, the Sacramento, the American, the Stanislaus, and the San Joaquin. Friant Dam, on the San Joaquin, was completed in 1944, forming Millerton Lake. This was one of 20 reservoirs in the CVP. Shasta Dam, the largest CVP storage facility, was completed in 1945. At Sacramento, American River water stored by Folsom Dam is added. 2.5 million acre-feet (3.1 km3) are annually pumped from the Delta into the Delta-Mendota Canal. New Melones Dam on the Stanislaus River was finished in 1979, and the reservoir was filled in 1982.
The CVP has generated concerns regarding environmental damage, prices charged to farmers, and lax enforcement of farm size limitations. Bureau of Reclamation water was supposed to be used for farms limited to 160 acres (65 ha) (see Homestead Act). Under Spanish and Mexican land grants, however, there were only a few land owners, all of whom owned large tracts of land. A 1982 reform increased CVP area limits to 960 acres (3.9 km2). In 1992, the Central Valley Project Improvement Act made fish and wildlife protection and restoration an authorized purpose of the CVP on an equal footing with other authorized purposes. 0.8 million acre-feet (0.99 km3) of annual runoff were dedicated to environmental usage.
The Colorado River is the source of 4.4 million acre-feet (5.4 km3) per year for California. Six other states along the river's watershed (Wyoming, Nevada, Utah, Colorado, New Mexico, and Arizona) and Mexico, share allocated portions of river water. The Metropolitan Water District of Southern California, or MWD, holds priority water rights on the Colorado. It sells water to 95 percent of the South Coast region. Lake Mead, formed by Hoover Dam, is the primary reservoir in the Colorado River basin. The Colorado River Aqueduct begins 155 miles (249 km) downstream from Hoover Dam, and can carry 1.2 million acre-feet (1.5 km3) annually.
An additional system diverts water from the Colorado River at the Imperial Diversion Dam provides waters to the Imperial and Coachella valleys as well as Yuma, Arizona, via the Alamo Canal, the Coachella Canal and the All-American Canal, which runs alongside the Mexican border. This system was also responsible for the accidental re-creation of the Salton Sea in 1905.
The Colorado is considered over-allocated, because apportionments were made on inaccurate measurements of annual runoff. Marc Reisner in Cadillac Desert noted that the Colorado is "unable to satisfy all the demands on it, so it is referred to as a 'deficit' river, as if the river were somehow at fault for its overuse". For years California took more than its share of the apportionment, because other states were not prepared to use their entire allotments. MWD became used to 0.8 million acre-feet (0.99 km3) excess of water. Pressure from other Colorado river states caused the Secretary of the Interior to order California to show progress towards decreasing its dependency on the excess 0.8 million acre-feet (0.99 km3), or face cuts. The Colorado River Water Use Plan called for Imperial and Coachella Valley agriculture to give up water in order to reallocate 0.8 million acre-feet (0.99 km3) within the state. The plan's proposals generated much controversy, and the deadline arrived with no agreement reached. The Department of the Interior reduced MWD's access by 0.415 million acre-feet (0.512 km3).
The Los Angeles Aqueduct carries water from the Eastern Sierra Nevada to Los Angeles. The construction of the aqueduct marked the first major water delivery project in California. The city purchased 300,000 acres (1,200 km2) of land in the Owens Valley in order to gain access to water rights. The Los Angeles Department of Water and Power transports 0.4 million acre-feet (0.49 km3) of Eastern Sierra Nevada water to the city each year. This growth clearly shows William Mulholland's observation that "Whoever brings the water, brings the people."
After four decades of diversion from the Mono Lake area, environmental damage created an environmental battle in the 1980s, with a victory for the Mono Lake proponents in 1994. Other problems arose when dust from the bed of Owens Lake (completely dried up by diversions) became a major source of air pollution in the southern Owens Valley. To restore Mono Lake, correct air-quality law violations, and rewater portions of the Owens River, Los Angeles has begun to reduce its dependence on Eastern Sierra Nevada water. This has mostly been achieved through water conservation. The city enacted a program offering free low-flow toilets to its customers.
The Hetch Hetchy Aqueduct carries water from the Tuolumne River to San Francisco and other Bay Area regions. The system starts in Hetch Hetchy Valley, inside Yosemite National Park. The system also generates up to 400MW of electrical power, depending on rainfall, most of which is sent to San Francisco via city-owned power lines. After water leaves Hetch Hetchy, it passes through tunnels towards powerhouses. Three pipes then bring the water across the Central Valley. Concerns about the Hetch Hetchy Aqueduct's ability to withstand earthquakes led to a $1.7 billion bond, approved by voters in November 2002.
The East Bay Municipal Utility District (EBMUD) serves 35 communities in Alameda and Contra Costa Counties, including Berkeley and Oakland. The Mokelumne River in the central Sierra Nevada is the source for almost all of EBMUD's water. EBMUD built the Pardee Dam across the Mokelumne in the foothills northeast of Stockton. South of Pardee is Camanche Reservoir, which regulates releases to serve downstream water rights holders. EBMUD holds almost 30,000 acres (120 km2) in the Mokelumne River watershed and 25,000 acres (100 km2) in other watersheds. EBMUD also has an American River water right that could be sent to the Mokelumne Aqueduct through the Folsom South Canal. The only time this has been done was during the drought years of 1977–78, when the water was actually pumped from the Delta. EBMUD preferred the cleaner water from the American River, but environmentalists and Sacramento had concerns about the impacts such a diversion would have on the river. The legal battle led to affirmation of EBMUD's water right, but modifications were also negotiated. The intake point was moved downstream, to maintain minimum flows in the American River before it merges with the Sacramento.
The North Bay Aqueduct of the California State Water Project delivers an annual average of 39,309 acre⋅ft (48 million m3) of water to urban communities and agricultural users in Napa, Solano, Sonoma and Marin counties. That water is diverted from the Sacramento-San Joaquin River Delta Estuary, a water hub that serves as the junction of south-, west-, and north-flowing rivers draining the Cascade and Sierra Nevada mountain ranges.
Certain municipalities north of San Francisco Bay, including Santa Rosa and Petaluma, are served by the Sonoma County Water Agency. Their primary water source is the Russian River. However, the Russian River owes its summer flow in large part to the Eel, which is bled off via a tunnel into Potter Valley (via the Potter Valley Project) and flows to a reservoir near Ukiah, Lake Mendocino. PG&E now owns the rights to this delivery system, as well as the long controversial history. There are many along the Eel who would like their water back.
The cities of Vallejo, Fairfield, and Vacaville are served by the Solano County Water Agency, which transports water from Lake Berryessa and moves it south along the Putah South Canal. Marin County has the Marin Municipal Water District, the North Marin Water District, and the Inverness Public Utility District.
The planning and management of water in California is subject to a vast number of laws, regulations, management plans, and historic water rights. The state agency responsible for water planning is the California Department of Water Resources.
There have been several documents known as the "California Water Plan", with the most recent being published in 2013. Before the state of California started drafting comprehensive plans for the management of water in the state, the earliest plan for water distribution in California was an 1873 report. This was followed by a 1919 report called "Irrigation of Twelve Million Acres in the Valley of California". The 1919 report is the first comprehensive plan, and is often called the "Marshall Plan", after its author Col. Robert Bradford Marshall (not to be confused with the European program from 1948 of the same name). There have been many subsequent water plans and water plan updates, which were often issued as California Department of Water Resources bulletins. California Water Code provides guidance or the plan updates. Beginning in 1957, early Water Plan Updates were largely technical and focused on water supply development. Plans gradually became more comprehensive to address the state's growing conflicts over limited resources. Updates now present the status and trends of California's water-dependent natural resources; water supplies; and agricultural, urban, and environmental water demands for a range of plausible future scenarios. They also evaluate different combinations of regional and statewide resource management strategies to reduce water demand, increase water supply, reduce flood risk, improve water quality, and enhance environmental and resource stewardship. The evaluations and assessments performed for the updates help identify effective actions and policies for meeting California's resource management objectives in the near term and for several decades to come.
Since 2000, another major goal for each update has been to receive broad input and support from Californians. Preparation of these new millennial Water Plan updates has been widely viewed as exceptionally transparent and collaborative as the consensus seeking process is routinely cited by other agencies and states as a model for policy planning efforts. The approach involves: interest based dialog and exchange among teams, committees and the public to develop work products; multiple opportunities for review by different audiences; and integration and reconciliation of feedback from a variety of perspectives.
Update 2013 is based on the plan laid out by the administration of Governor Edmund G. Brown Jr. (Jerry Brown). That five-year plan, released in January 2014, outlines a succinct set of actions that together bring reliability, restoration, and resilience to California water resources, even as the state's population is expected to grow from 38 million to 50 million by 2049.
Three related themes distinguish Update 2013 from Update 2009. The five year time span reinforced the value of integrated water management, and Update 2013 closely examines the practices and policies that allow water managers to combine flood management, environmental stewardship, and surface water and groundwater supply actions to deliver multiple benefits across a region. Fundamental to that integrated approach is better alignment in the management of data, planning, policy-making, and regulation across local, State, tribal, and federal governments.
Water purity has been an emerging issue in California, especially in communities with low-income residents. Aging infrastructure, coupled with a lack of research on the topic, has exacerbated this issue, with water health violations occurring in 7–8% of water systems a year. The San Joaquin Valley, a largely rural and agricultural area with 65% residents being people of color, is registered with the most water quality violations. Tulare, a city within San Joaquin Valley, has 99% of its residents relying on compromised groundwater, contrasted with Los Angeles County, with 11% of residents relying only on a contaminated water supply. These water violations often lead to purchased water sources and private ownership of water distribution, as private utilities appear to have larger bandwidth to serve a large population. Trade-offs often include greater inequity in water access, as private utilities face higher repercussions for delivering unsafe water and often decide to opt-out from serving under-resourced populations.
The U.S. Geological Survey analyzed the results of a 2002 study of 10 streams in California and discovered that the Sacramento River had the highest traces of acetaminophen, cholesterol and birth control hormones of any water source in the nation. Pharmaceutical discharge polluted by drug companies are relatively common in California water, with Southern California water tables especially susceptible to contamination.
On more than one occasion, the California Supreme Court has noted that "the scope and technical complexity of issues concerning water resource management are unequalled by virtually any other type of activity presented to the courts." An example of this complexity is demonstrated in the case of National Audubon Society v. Superior Court.
California recognizes water rights granted to pueblos (settlements) under the Spanish and Mexican governments, prior to the Treaty of Guadalupe Hidalgo. Under the doctrine, pueblos organized under the laws of Mexico or Spain have a water right to the yield of all streams and rivers flowing through the city and the groundwater aquifers lying below. Pueblo water rights are superior to all riparian and appropriative rights and cannot be lost by a failure to assert an interest or use the water. In addition, the pueblo's claim expands with the needs of the city and may be used to supply the needs of areas that are later annexed to the city. Los Angeles and San Diego are the only original pueblos to exercise their pueblo water rights in the courts.
Pueblo water rights are controversial. Some modern scholars and courts argue that the pueblo water rights doctrine lacks a historical basis in Spanish or Mexican water law.
A landowner who has their property border a river has a right to use that land. Under the riparian doctrine, "the owner of land has the right to divert the water flowing by his land for use upon his land, without regard to the extent of such use or priority in time". "Riparians on a stream system are vested with a common ownership such that in times of water shortage all riparians must reduce their usage proportionately."
Riparian water rights were inherited from the common law of England. Under the doctrine, property owners have correlative rights to the reasonable use of the water passing through their land adjacent to the watercourse. The right is part and parcel with the land itself and, in California, only accompanies those tracts that have always directly touched the water.
Riparian rights received legal recognition after California gained statehood. It then became law that owners that have property touching a water source have a right to that water and it cannot be appropriated by another party.
The English focus on landownership differs sharply from the "first in time, first in right" approach 49ers, who were generally trespassing on federal land, developed to wash hills into rivers. In Lux v. Haggin (1886) the California Supreme Court resolved the conflict by finding that riparian water rights are superior even to older prior appropriations. When in 1926 the Court went so far as to find that riparian owners did not need to put their water to beneficial use, the People amended the California Constitution to reverse the decision, establishing that no water in the state may be wasted.
While riparian rights are superior to appropriative rights and may survive dormant and unused, in 1979 the California Supreme Court found that the California State Water Resources Control Board has the power to assign unused riparian rights lower priority than existing prior appropriations.
"The appropriation doctrine confers upon one who actually diverts and uses water the right to do so provided that the water is used for reasonable and beneficial uses," regardless of whether that person owns land contiguous to the watercourse. In addition, all appropriative rights are subordinate to riparians or earlier appropriators. In times of shortage riparians are entitled to fulfill their needs before appropriators are entitled to any use of the water. "And, as between appropriators, the rule of priority is 'first in time, first in right.'" Beginning in 1914, a statutory scheme has provided the exclusive method of acquiring appropriation rights through the California State Water Resources Control Board. The modern system of prior appropriation water rights followed by California is characterized by five principles:
- Exclusive right is given to the original appropriator, and all following rights are conditional upon precedent rights.
- All rights are conditional upon beneficial use.
- Water may be used on riparian lands or non-riparian lands (i.e. water may be used on the land next to the water source, or on land removed from the water source)
- Diversion is permitted, regardless of the shrinkage of the river or stream.
- The right may be lost through non-use.
Beneficial use is defined as agricultural, industrial, or urban use. Environmental uses, such as maintaining body of water and the wildlife that use it, were not initially regarded as beneficial uses in some states but have been accepted in some areas.Every water right is parameterized by an annual yield and an appropriation date. When a water right is sold, it maintains its original appropriation date.
Lands reserved by the United States government are accompanied by a corresponding reservation of water rights for as much water is needed to fulfill the purpose for which the reservation was made. Such reservations were made on behalf of Native American tribes, national parks, monuments and forests. Water rights reserved by the United States are defined by and controlled by federal law, and may conflict with state law because reserved water rights are neither riparian nor appropriative.
California provides communities and other water users within watersheds senior status over appropriative water rights in limited circumstances. California area of origin laws include The County of Origin Law (1931), The Water Protection Statute (1933), and The Delta Protection Act (1959).
Since under the law, landowners can extract as much groundwater from their property as they can put to beneficial use, adjudication was used to determine who had the right to pump how much and to audit such usage. The courts appoint water masters to audit usage and otherwise enforce water rights, who are often management boards, the United States Department of the Interior, the California Department of Water Resources, or an individual.
The California water wars, a struggle between Los Angeles and certain parties within the Owens Valley, for water rights is but one example of the alleged wrongdoings of municipalities and people in securing adequate water supplies. The city of Los Angeles bought 300,000 acres (1,200 km2) of land from residents of the Owens Valley and the water rights attached with them, for a fair price. The diverting of this water from the valley, transformed it from an agricultural valley into a dust bowl.
The creation of so many dams in California in order to enact a water diversion program for conventional agriculture has been met with criticism from most environmentalists, who have decried the negative effects of dams on ecosystems, particularly on migratory fish populations.
It is projected that California's population will grow to almost 50 million by 2050. If the prediction comes true and there is no action to increase the water supply, the difference between water demand and supply would be between 2.0–6.0 million acre-feet (2.5–7.4 km3) in the year 2020. Over the past five years California voters have approved $3 billion in bonds for water development and management. Many of these projects are incorporated in the CALFED Bay-Delta program, a federal-state program designed to reduce water supply conflicts. In August 2000 the state and federal governments approved the CALFED plan for water quality, water conservation and recycling, watershed administration, ecosystem re-establishment, delta levees, surface and groundwater storage, water transportation, and science. The plan has a thirty-year implementation period and was designed to incorporate changes in conditions and knowledge about the effects of specific projects. Stage 1 was initiated in 2000 and was designed as a seven-year program. The cost is estimated to be $8.7 billion. Stage 1 water yield within the next seven to ten years is estimated to be 2.9 million acre-feet (3.6 km3) per year. As part of Stage 1, an Environmental Water Account was established through the purchase of 0.35 million acre-feet (0.43 km3) of water. The EWA is used to protect fish and other wildlife without reducing water allocations to farms and municipalities.
A $7.5 billion water bond was approved in November 2014 with a 2 to 1 ratio. The bond-financing, which has been contentiously debated by the legislature and Governor Jerry Brown for the past few years, was said to improve the water quality, supply and infrastructure, if passed by voters.
- 1917–21
- 1922–26
- 1928–37
- 1943–51
- 1959–62
- 1976–77
- 1987–92
- 2007–09
- 2012–15
The burning of fossil fuels, which has been occurring at an unprecedented rate since the Industrial Revolution in the 1950s, has increased the concentration of greenhouse gases, particularly carbon dioxide and methane, in the atmosphere. In 2018, atmospheric carbon dioxide concentrations were 407 parts per million (ppm), and the Global Carbon Budget estimated that emissions would continue to grow by 0.6% each decade. Increased concentrations of greenhouse gases in the atmosphere have caused Earth's global surface temperatures to increase as well, a phenomenon called climate change. In 2018, the Intergovernmental Panel on Climate Change (IPCC) estimated that global average temperatures were increasing by 0.2 °C each decade and that the climate that year was 1 °C above preindustrial levels. The IPCC warns that anthropogenic emissions must decrease to limit climate change and its impacts; In California, the United States Environmental Protection Agency (EPA) predicts that sea level rise between 1–4 by 2100, more extreme weather conditions, and changes in precipitation due to climate change will have an impact on the state's water resources. In addition, these impacts will also change the state's water management systems and policies. According to the Public Policy Institute of California, the number of people and the value of property is increasing in flood prone regions of the state, including Sacramento, which means that the economic risk and threat to public safety is increasing. This reality is illustrated by the 2017 Oroville Dam failure where 180,000 were emergency evacuated and nearly $500 million in damages were accrued.
Although the Earth's oceans have been rising since the last ice age around 18,000 years ago as a result of melting sea and land ice, climate change is expected to accelerate the rate of global sea level rise. According to California's Fourth Climate Change Assessment, published in 2018, climate change will stimulate 54 inches of sea level rise by 2100 if greenhouse gas emissions continued at their current rates. This phenomenon is expected to cause coastal and estuarial flooding which will have both economic, environmental, and political ramifications in terms of water. In fact, scientists at the California Department of Water Resources believe that sea level rise will cause more salt water to intrude the Sacramento-San Joaquin Delta, the state's largest estuary, "the heart of the California water supply system and the source of water for 25 million Californians and millions of acres of farmland." Rising sea levels will also present flood hazards from storms and saltwater intrusion to coastal aquifers, according to the department's report.
Climate change will also cause more extreme weather conditions to occur in the state. In general, California's climate will become dryer and warmer over time. According to the United States Geological Survey, higher atmospheric surface temperatures and warmer ocean waters create fuel for more powerful storms, like hurricanes or monsoons, to develop and can lead to faster wind speeds during storms. This effect will cause more frequent and extreme droughts as well as extreme precipitation events that could cause flooding according to the National Climate Assessment. In fact, these effects are already evident in the state. For instance, the drought of 2012–2016 was the most extreme drought that the state has ever seen, and droughts were the most common disaster source in California in 2016 according to the State of California Hazard Mitigation Plan. In addition, monitoring by the California Department of Water Resources suggests that droughts have become more severe since the Industrial Revolution. In fact, the drought of 2012 to 2016 was the most extreme drought that the state has ever seen. At the same time, floods have also been worsening over time and will continue to become more extreme as atmospheric temperatures continue to increase.
Although California has always had extreme daily, monthly, and annual variations in rainfall, the state's precipitation patterns have become increasingly variable over time, trending towards a drier climate as a result of global warming. Among all of the effects of climate change, changes in precipitation will be the hardest to predict. However, studies conducted by the California Natural Resources Agency suggest that there will be more dry days and years in the future with occasional downpours. More specifically, they estimate that the southern and inland regions of the state that are already dry to become more arid over time while the northern part of the state that currently receives a majority of the state's rainfall will continue to get wetter with the onset of climate change. In addition, the increase in atmospheric temperatures will also lessen the amount of precipitation that falls as snow. A 2017 UCLA study found that "anthropogenic warming reduced average snowpack levels by 25%, with mid-to-low elevations experiencing reductions between 26-43%." The implication of this precipitation pattern change is that immediate runoff will increase making the winter months a lot wetter, and that there will be a longer, warmer dry season in the spring and summer months. By the end of the century, the California Department of Water Resources predicts that the Sierra Nevada snowpack, the state's primary freshwater source, will decrease by 48-65% from its April 1 average.
Climate change impacts related to water, including sea level rise, more extreme weather conditions, and changes in precipitation, will have various effects in California. The state's water infrastructure, including dams, levees, and canals, are out of date, and they are particularly ill-suited in light of climate change. For instance, decreased snowpack and increased immediate rain runoff will increase the risk of infrastructure failure and flooding in the state. In fact, the state's water management systems are already failing as a result of changing precipitation as was the case in the 2017 Oroville Dam crisis. At the same time that climate change will increase flooding, it will also cause more frequent and extreme droughts as the state's climate continues to become drier over time. By utilizing the Palmer Drought Severity Index, the National Oceanic and Atmospheric Administration (NOAA) found that droughts in the state will become more severe in the next 40 years with the onset of climate change. This means that there will be less water for the state to distribute. California's Fourth Climate Change Assessment found that water storage in the state's two largest reservoirs, Shasta and Oroville, will decrease by one third under current management systems. This decreased water storage combined with less spring and summer runoff conflicts with the state's water demand. To date, most of California's precipitation falls as snow in the winter months, and it flows into rivers and streams in the spring and summer months as the snow melts. This is an important aspect of California's water management systems because most of the state's water demand occurs in the late summer months during the agricultural growing season. As temperatures continue to increase this effect will diminish, and the state will have to find a way to store water from the winter months to the summer months when it is most needed.
The California Water Documents collection in the Claremont Colleges Digital Library is a valuable online resource of archived materials related to California's water history. Additionally, the collection has digitized materials relating to the creation and operation of both the Central Valley Project and the California State Water Project as well as their component units. The items represented in the Claremont Colleges Digital Library are part of a larger collection entitled the Water Resources Collection in Special Collections at Claremont Colleges' Honnold/Mudd Library. The Water Resources Collection was started in the 1930s by Librarian Willis Holmes Kerr and Librarian and Claremont Colleges' Trustee John Treanor. These librarians' interest in California's water problem led them to start collecting a variety of documents related to water history and usage from around the state. It includes reports of engineers, annual reports and minute books of boards of directors of water companies, documents of federal and state governments, promotional pamphlets, and newspaper clippings. Most of the documents focus on the water history from the first half of the 20th century, but there are additional, more recent publications included, which have been donated by Claremont Graduate University Professor Merrill Goodall. The California Water Documents collection is currently a work in progress at the Claremont Colleges Digital Library.
The Water Resources Collections and Archives is located at the University of California, Riverside and features a comprehensive collection of water-resource related documents.
- California Water Fix and Eco Restore plan
- Groundwater-related subsidence
- List of lakes in California
- List of largest reservoirs of California
- Newlands Reclamation Act, a 1902 federal law that funded irrigation projects for 20 western states
- Sustainable Groundwater Management Act
- Water-energy nexus
- Northern Cyprus Water Supply Project
- California water resource region
- California State Department of Water Resources
- California State Department of Water Resources
- United States Geological Survey, California Water Science Center
- California's Water Infrastructure Systems
- [1]
- California Water Documents in Claremont Colleges Digital Library
- Water Resources Collection in Special Collections at Claremont Colleges' Honnold/Mudd Library
- Water Resources Collections and Archives in the University of California, Riverside Libraries
- List of water research centers (archived 2016) at the UCs and CSUs
- California State University, San Bernardino, Water Resources Institute
- University of California, California Institute for Water Resources
- Clifton Ewing Hickok Papers. Yale Collection of Western Americana, Beinecke Rare Book and Manuscript Library.
Instances of environmental injustice[edit | edit source]
Instances of environmental injustice include:
- Diabetes in Los Angeles County Latino children
- Proximity of schools to vehicle traffic in Culver City
- Fracking violations in Kern County school zones
- Inequalities in cumulative environmental burdens among three urbanized counties
and
Proposed coal terminal in West Oakland[edit | edit source]
Pollution in California relates to the degree of pollution in the air, water, and land of the U.S. state of California. Pollution is defined as the addition of any substance (solid, liquid, or gas) or any form of energy (such as heat, sound, or radioactivity) to the environment at a faster rate than it can be dispersed, diluted, decomposed, recycled, or stored in some harmless form. The combination of three main factors is the cause of notable unhealthy levels of air pollution in California: the activities of over 39 million people, a mountainous terrain that traps pollution, and a warm climate that helps form ozone and other pollutants. Eight of the ten cities in the US with the highest year-round concentration of particulate matter between 2013 and 2015 were in California, and seven out of the ten cities in the US with the worst ozone pollution were also in California. Studies show that pollutants prevalent in California are linked to several health issues, including asthma, lung cancer, birth complications, and premature death. In 2016, Bakersfield, California recorded the highest level of airborne pollutants of any city in the United States.
The Federal Clean Water Act defines water pollution as "dredge spoil, solid waste, incinerator residue, sewage, garbage, sewage sludge, munitions, chemical wastes, biological materials, heat, wrecked or discarded equipment, rock, sand, cellar dirt, and industrial, municipal, and agricultural waste discharged into water." In 2011, an Environmental Protection Agency (EPA) study showed that water quality standards were not met on 1.6 million acres of California's 3 million acres of lakes, bays, wetlands, and estuaries. The Porter-Cologne Water Quality Control Act governs the water quality regulation in California.
In 1943, people first recognized episodes of smog-causing irritated eyes, burning lungs, and nausea, and this led people to walk the city's streets wearing masks to shield the thick air. Beginning in 1967, a group of California politicians and leaders teamed up to unify statewide efforts to address the severe air pollution, creating The Mulford-Carrell Air Resources Act, which formed the California Air Resources Board (CARB). That same year, the Federal Air Quality Act of 1967 was enacted, which allowed California to set more stringent air quality rules due to its unique conditions of geography, weather, and growing population. Despite dramatic progress, air pollution in the United States, and California in particular, continues to harm people's health and environment. Under the Clean Air Act (United States) of 1970, the EPA works with state and local governments and federal agencies to reduce air pollution and limit the damage that it causes. The Act was amended in 1977 and 1990, establishing emission standards that require the maximum degree of reduction of hazardous air pollutants.
The CARB continues to work with local governments, the business sector, and the public to address California's air quality problems. In the past decade, California has become a global leader in climate change by entering agreements with several nations and linking cap-and-trade programs with Quebec. Many programs have been established to reduce greenhouse gas emissions, including a Zero Emission Vehicle mandate, which is planned to clean up the transportation sector and add about 1.5 million hydrogen fuel cell vehicles to the roads by 2025. The cap-and-trade program has allowed billions of dollars to be invested in reducing greenhouse gases in cities throughout California. While California has taken significant action to decrease pollution, the state remains behind the rest of the nation. The ever-growing population, abundance of cars, and sunny weather continue to foster a pollution-friendly environment.
According to the American Lung Association's recent "State of the Air 2017" report, California is a leader in air pollution among other states, with the highest ozone levels. The top three cities in the country with the highest recorded levels of ozone (smog) levels were Los Angeles-Long Beach, Bakersfield, and Fresno-Madera. Salinas, California is the only city of California that reports no days of unhealthy air quality. While the air quality in California is significantly better in northern California, more than ninety percent of Californians live in counties with unhealthy air.
The state of air pollution has been improving in Los Angeles, although it remains the city with the worst ozone pollution. With a population of roughly over 10 million, the Los Angeles area is a large basin with the Pacific Ocean to the west, and several mountain ranges with 11,000-foot peaks (3,400 m) to the east and south, Los Angeles is particularly susceptible to high ozone levels. Diesel engines, ports, motor vehicles, and industries are main sources of air pollution in Los Angeles. Frequent sunny days and low rainfall contribute to ozone formation, as well as high levels of fine particles and dust. The strong relationship between Air Quality Index (AQI) and ozone levels may be found on air pollution maps.
Smog is formed when primary pollutants, usually emitted from vehicles, react with ultraviolet rays to create secondary pollutants. When these primary and secondary pollutants combine, it creates the thick haze that can be seen hovering over the city. While ozone can protect the environment from powerful ultraviolet rays, an overabundance of this ozone can be extremely harmful to the health of people and wildlife. As the city rests in a basin between mountains and an inward-sweeping wind from the Pacific Ocean, the ozone, smog, and other toxic particles stagnate in the middle of the Los Angeles Atmosphere with nowhere to escape. Stagnant atmospheric conditions are fairly typical for Los Angeles atmosphere due to frequent atmospheric inversion (that holds multiple pollutants within over the city in the form of "pollution dome"). The effect of "pollution dome" leads to enhanced concentration of greenhouse gases as well such as methane and carbon dioxide. Researchers have shown that carbon dioxide enhancement in the "dome" over Los Angeles is one of the strongest in the world and it is easily detectable from the satellite observations.
Air pollution in Los Angeles has caused widespread concerns. In 2011, the Public Policy Institute of California (PPIC) Survey on Californians and the Environment showed that 45% of citizens in Los Angeles consider air pollution to be a “big problem”, and 47% believe that the air quality of Los Angeles is worse than it was 10 years ago. The most recent PPIC Survey of 2018 showed that the strong majority of California adults (72%) and likely voters favor the new state law mandating reductions in greenhouse gas emissions, and 56% of adults support the state's cap-and-trade program. In addition, about half of Californians believe state climate policies will lead to more jobs, while the other half expects the price of gasoline to rise. In 2013, the Los Angeles-Long Beach-Riverside area ranked as the 1st most ozone-polluted city, the 4th most polluted city by annual particle pollution, and the 4th most polluted city by 24-hour particle pollution.
While Los Angeles is by far the leading polluter in the nation, many of the cities in the greater Bay Area often find themselves in the top ten of several pollution charts. Los Angeles's geographical constraints and sprawling layout can be assigned partial blame for their unique pollution circumstances, but the Bay Area is an enormous cluster of large cities that collectively contribute to their own pollution problem. In the State of the Air report, published by the American Lung Association, three of the nine Bay Area counties were listed as receiving failing grades on their pollution scores, namely Alameda, Contra Costa, and Santa Clara. Furthermore, while short-term and year-round particle pollution appeared to slightly improve, ozone levels were made worse from 2014 to 2016. For short-term particle pollution, San Francisco, San Jose, and Oakland ranked sixth in the nation, and the entire Bay Area placed 13th in ozone pollution, which experts say is due to several factors, especially climate change, wildfires, and emissions. The wildfire pollutants are particularly dangerous to the public, as these particles are usually invisible and can have detrimental effects on one's health. When considering the pollution levels in the Bay Area and in most of the Southern half of the state, California has several polluted sites that require the close attention of scientists.
In economics, an externality occurs when the producer does not have to pay its full cost, and when it affects another party either positively or negatively. If the cost to society is greater than the cost the consumer is paying for it, then the externality is negative because it imposes this extra cost on society, which can lead to market inefficiencies. Solving the problem of negative externalities can be costly on its own, as it is often difficult to assign responsibility. Typically, the party who owns the property rights to the polluted area is responsible for paying the cost, but alternative strategies include taxing the producer or collecting payments from a determined group of individuals. California suffers specifically from negative production externalities, which is when a firm's production reduces the well-being of others who are not compensated by the firm.
Pollution is one of the most common forms of negative externalities present in the world economy, and this is especially true of California, which suffers from the worst pollution levels in the country. It can also arrive in many forms, such as air pollution, water pollution, farming pollution, and noise pollution. The Market for Air Pollution graph helps visualize how pollution works as a negative externality within California: since the costs for reducing pollution are lower at the market equilibrium, the market will shift to the social equilibrium to reduce the quantity of pollution.
The negative externalities incurred from pollution are numerous, as its broad nature has the capacity to affect masses of people at once. While the health costs are the most obvious, the following sections provide more insight into the negative externalities suffered by the California public.
There have been studies conducted that point to the possibility of fertilized land being the cause of the vast amounts of smog in suburban areas. Nitrogen, which is present in soil, leaks into the air creating nitrogen oxide in which is a main component of smog. This amount of NOx that is leaked into the air can cause the majority of health issues that are observed in California. These health conditions were described in the introduction and can be detrimental to children and the elderly. Image A below, shows the drastic difference of the amount of nitrogen that is expelled into the air due to fertilizer. Mogenson states that 4% of the states nitrogen oxide emissions come from soil on agricultural land even though there is not any agricultural land near the hotspots of California's smog studies such as Sacramento and Los Angeles.
Both ozone and particle pollution are dangerous to human health. The Environmental Protection Agency (EPA) engaged a panel of expert scientists, the Clean Air Scientific Advisory Committee, to help them assess the evidence. The EPA released their most recent review of the current research on health threat of ozone and particle pollution.
EPA Concludes Ozone Pollution Poses Serious Health Threats:
- Causes respiratory harm (e.g. worsened asthma, worsened COPD, inflammation)
- Likely to cause early death (both short-term and long-term exposure)
- Likely to cause cardiovascular harm (e.g. heart attacks, strokes, heart disease, congestive heart failure)
- May cause harm to the central nervous system
- May cause reproductive and developmental harm
EPA Concludes Fine Particle Pollution Poses Serious Health Threats:
- Causes early death (both short-term and long-term exposure)
- Causes cardiovascular harm (e.g. heart attacks, strokes, heart disease, congestive heart failure)
- Likely to cause respiratory harm (e.g. worsened asthma, worsened COPD, inflammation)
- May cause cancer
- May cause reproductive and developmental harm
Personal exposure to the air pollution can be reduced by staying indoors on days with levels of high air pollution. Air quality can be checked by using scales that mention moderate, unhealthy, or hazardous air quality conditions. Other ways to avoid the air pollution would be reducing outdoor air infiltration to indoors, cleaning indoor air with air filters, and limiting physical exertion, especially outdoors and near air pollution sources. Avoiding exposure to air pollutants is especially important for susceptible individuals with chronic cardiovascular or pulmonary disease, children, and the elderly. There are also pharmaceutical or chemopreventive interventions such as antioxidants. Many health threats from poor air quality can cause cancer, avoiding the air pollution and taking antioxidants will help improve the health of those who are most affected by poor air quality.
The specific purpose of the Asthma-Friendly Outdoor (Ambient) Air Quality Flag Program was to establish an education and communication tool for Central California communities that would accomplish two things: (1) Establish permanent local policy change to existing operating procedures in school districts and schools to help reduce the exposure of students, teachers, staff, and nearby communities to outdoor environmental asthma triggers and (2) provide education on air quality and potential health effects of exposure to air pollutants. Science-based, simple, visual, low-cost school-based educational interventions to help reduce human exposure to outdoor environmental asthma triggers (i.e., ozone, particles, and pollens) can work in socioeconomically and ethnically diverse urban and rural or agricultural communities, and (2) local health and environmental justice groups such as asthma coalitions can successfully lead school-based environmental interventions to help improve children's quality of life. Programs like these are important for sensitive children who can experience dangers situations in health conditions due to air pollution or poor air quality. It is important for certain kids who are most sensitive to these negative effects of air pollution to be involved in programs like the Asthma Friendly Outdoor program.
The San Joaquin Valley of California has poor air quality and high rates of asthma. Surveys were collected from 744 residents of the San Joaquin Valley from November 2014 to January 2015 to examine the public's views about air quality. Based on the information gathered, those in the San Joaquin Valley who are exposed to the highest concentrations of a certain air pollutant ranked the air quality in their area much lower compared to other regions who experienced lower concentrations of that air pollutant. The air quality is calculated to be either moderate or unhealthy, especially for sensitive groups such as children, since there is a strong association between poor air quality and asthma. However, there is a great disproportionality when it comes to who experiences the worst of the air quality and who causes it. In 2002 the National Air Toxic Assessment (NATA) identified areas that are at high respiratory risk in the San Joaquin Valley and according to the U.S. Census Bureau, over half of the population in these communities are Hispanic and a quarter lives under the poverty line. Importantly though, these communities also exhibit the highest percentages of residents under 18 years old, who are also some of the most vulnerable to developing respiratory issues. On the contrary, the communities with the lowest risk have a predominantly white middle-class population, with only 38% being Hispanic and 16% living under the poverty line.
As stated before, nitrogen oxide (NOx) is a main cause of the respiratory issues in California and that 4% of NOx comes from agricultural land alone. The San Joaquin Valley is one of California's top ten producers of agriculture and this sector of the economy makes up the majority of jobs in the Valley. Consequently, agriculture contributes to 35% of the Valley's air pollution making it the largest contributor compared to other contributors such as cars and trucks, forest fires, etc. However, it was not until 2004 that farms in California were required to meet the same permit requirements as other industries in terms of air pollution.
Helping California meet the national air quality standards and improve the health of local residents continues to be a priority for the EPA. One of EPA's highest priorities is to support the reduction of diesel emissions from ships, trucks, locomotives, and other diesel engines. In 2005, Congress authorized funding for the Diesel Emissions Reduction Act (DERA), a grant program, administrated by the EPA, to selectively retrofit or replace the older diesel engines most likely to impact human health. Since 2008, the DERA program has achieved impressive outcome of improving air quality. The EPA also works with state and local partners to decrease emissions from port operations and to improve the efficient transportation of goods through the region. Together with the Port of Long Beach the EPA and the Port of Los Angeles are partners of the San Pedro Bay Ports Clean Air Action Plan, a sweeping plan aimed at significantly reducing the health risks posed by air pollution from port-related ships, trains, trucks, terminal equipment and harbor craft. These two ports are the busiest container ports in the United States. For environmental justice, air pollution in low-income LA communities has received more attention. In 2011, the “Clean up Green up” campaign was launched to designate three low-income LA communities: Pacoima, Boyle Heights and Wilmington. This campaign aims to push green industries through incentives, including help obtaining permits and tax and utility rebates. Although Los Angeles air pollution level has declined for the last few decades, citizens in Los Angeles still suffer from high level air pollution.
Additionally, in efforts to shift away from the practice of agriculture burning, the act of burning crop fields as a means of managing vegetation, diseases, weeds, etc. which contributes to air pollution, the California State Legislature passed a Bill to completely phase out this agricultural practice between 2005 and 2010. However, the California Air Resources Board (CARB) and San Joaquin Valley Air Control District have been postponing the prohibition to burn for certain crops and materials and it was only until recently, June 2021, that they reported that by January 2025 there will be little to no use of agricultural burning throughout San Joaquin Valley. Furthermore, California Legislature recently subsidized the shift away from agricultural burning by providing $180 million to CARB and the San Joaquin Valley Air Control District to support their transition in finding alternatives.
With the modern world and the industrial expansion of gasoline and diesel-powered vehicles, tailpipe emissions continue to be vital contributors to air pollution. Each vehicle that has the capability of burning fossil fuels emits some sort of harmful substances, or exhaust gases, into the air every minute that they are running. Three of the most common gasses produced by vehicles include hydrocarbons, carbon monoxides and nitrogen oxides. However different in some ways, the formation of these gases within the engine all adhere to a single basic factor which happens to be the combustion of fuel and air. Combustion in no case is ever a perfect chemical reaction. In every combustion process there is either extra fuel or not enough fuel; therefore, creating and emitting unwanted gases.
Firstly, there is hydrocarbons which is the most common and a very abundant pollutant of vehicles. Hydrocarbons are the products of fuel that have not burnt through the process of combustion. In some cases of combustion, fuel remains a raw vapor as it exits the tailpipe of the vehicle. These particles of raw gasoline vapor, or hydrocarbons, go through the entirety of the combustion process without taking part in the process and manages to escape into the air we breathe. Along with raw fuel, there are other factors to vehicles emitting hydrocarbons as well. For example, in a vehicle, the fuel system is pressurized. This is because gasoline is highly volatile and any small leak can mean that the gas vapors, or hydrocarbons, will escape into the air. These small leaks can be anywhere within the entire "Evaporative Emission Control System," or the system that houses and delivers the fuel to the engine. Any cracks in fuel lines or ventilation hoses along with even worn or loose gas caps will cause raw gasoline particle to escape into the air, polluting it with hydrocarbons.
There is also the issue of the combustion taking place with a concentration that is too fuel rich. In this case, we find that there is the formation of carbon monoxides. Carbon monoxide is formed in the combustion process when there is the combustion of fuel with insufficient amounts of oxygen, preventing the formation of the normal carbon dioxide and therefore ends up forming carbon monoxide molecules, which can possibly be fatal to humans.
Another harmful substance that results from the combustion process is nitrogen oxide. Nitrogen oxide is formed not as a deformity, but rather is a result of the different compositions of air. Air is composed of two main elements: nitrogen and oxygen. Therefore, as the engine intakes the surround atmospheric air for the combustion process, nitrogen happens to be one of the elements being sucked in. In the cases of regular ambient temperatures, the two gases nitrogen and oxygen are not chemically reactive with each other, yet when they are together inside the cylinder of an engine while combustion processes are occurring, they become reactive. These high temperatures inside the cylinders cause the nitrogen and oxygen atoms to bond creating the substance nitrogen oxide which is then emitted into the air through the tailpipe of the vehicle.
On average, each vehicle emits about 250 pounds of carbon monoxides, 18.32 pounds of nitrogen oxides, 29 pounds of hydro-carbons and 9,737 pounds of carbon dioxide every year. These gases emitted by vehicles are harmful to humans both directly and indirectly. The biggest and most widely known issue caused by vehicles is due to the carbon dioxide they produce. Carbon dioxide is known as a greenhouse gas because they ascend into the atmosphere and act as a blanket within our atmosphere causing the "Greenhouse effect". The "Greenhouse Effect" is a global phenomenon that is causing rises and temperatures and sea level. While the carbon dioxide continues to trap heat inside the atmosphere. With the rise of carbon dioxide gases in our atmosphere worldwide, transportation poses as one of the highest contributors to air pollution. According to the EPA, transportation produces around 29% of the Greenhouse Gas emissions worldwide.
Tailpipe emissions also pose a more direct harm to humans. The majority of the gases being emitted by the tailpipe of a vehicle can lead to numerous complications and health issues. Excess ingestion of any of the gases will sever oxygen delivery to ones organs, and can lead to serious issues such as breathing and heart problems. Mass intakes of these gases will begin damaging organs within a human body immediately, disabling a person's breathing capability. High doses of these gases can also contribute to heightened levels of allergic reactions, irritations, bronchitis and even pneumonia. Yet, even if large amounts of these gases are not ingested at once, small doses of these gases can lead to numerous long term detriments as well. Continuous small doses of these gases can lead to the deterioration of one's lungs and even contribute to future heart diseases.
In response to the emissions effects, California has taken the initiative to put in place multiple programs and organizations to help regulate tailpipe emissions from vehicles. Two of the largest governmental organizations instituted in California to reduce emissions effects include: California's Air Resources Board (CARB) and the Bureau of Automotive Repair (BAR). Each of these organizations take continuous efforts to revise the laws to ensure that vehicles that are being driven on the streets are not over polluting the environment that we live in. CARB and BAR cooperatively instate multiple regulations pertaining to the emissions components on cars which are California specific. Due to these efforts, California is widely known as one of the most regulated states when adhering to tailpipe emissions. In order to legally operate a vehicle in California, most vehicles must be CARB compliant as well as pass the biennial smog test.
The Smog Check program is one that has been instituted in most of the states throughout the United States, however, in California, the program proves to be one of the most stringent tests. The test is not stringent due to the nature of the testing procedure, but rather the emissions cut-points and defining of legal parts that California enforces. California goes about implementing different smog guidelines for different vehicle model years. For instance, according to the DMV website, vehicles of the model year 1975 and older are all smog exempt and do not need to go through the process of getting a smog inspection in California. It may be true that these older cars in actuality emit more pollutants than its newer counterparts, but from a cost effectiveness standpoint there simply aren't enough cars that are 1975 and older to implement smog tests on these vehicles. On the other hand, however, vehicles ranging from 1976 to 1996 have a multi-part smog inspection which needs to be completed once every two years. This test consists of the following: tailpipe emissions test, a visual inspection, an evaporative emissions system pressure test and a check to ensure ignition timing (on applicable vehicles). Each one of these components of the test are essential to keep a vehicle from over-polluting into the environment. The evaporative emissions system test, for example, would determine that the system is pressure tested and secured with no leaks so that excess hydrocarbons are not being emitted into the atmosphere. While on the other hand, the tailpipe emissions test directly measures the amount of pollutants that the vehicle emits. The State of California has set rigorous tailpipe emissions cut points for each vehicle that then determines whether it will pass or fail the emissions test. These cut-points are set for the amounts of hydrocarbons, carbon-monoxides, nitrogen oxides and percent carbon dioxide that a vehicle is permitted to emit before it is considered to be over-polluting. The Bureau of Automotive Repair and California's Air Resources Board conducts multiple tests throughout the year to gather enough sample data to set reasonable values for the cut-points for each vehicle within California. In doing so, the state's two main concerns are to limit air pollution, and prevent excess consumer failure rates. Therefore, through their roadside smog tests and emissions surveys California manages to maintain cut-points that reflect reasonable values.
Another major factor within the smog check program is the visual test. The visual test is important, especially in California because it ensures that vehicle emissions components are not damaged or tampered with. BAR and CARB have continuously implemented strict aftermarket or tampered parts guidelines specific to each vehicle make and model. Every vehicle registered in California must be equipped with either original equipment from the manufacturer or if it does contain any aftermarket emissions-related parts it must have an executive order approved by CARB. These executive orders ensure that the aftermarket part that is being installed on the vehicle will not increase the emissions of the vehicle. CARB has an extensive database of the parts that are legal to use within California and any vehicle equipped with these parts must also be equipped with a sticker or badge that indicates the executive order number of the part.
Most states will allow a vehicle to pass its smog inspection even when equipped with non-CARB approved parts installed on the vehicle, as long as the vehicle is still functioning properly. In terms of proper functionality, these states examine the vehicle check engine light and in some cases conduct a two-speed idle test in which vehicle emissions are examined at a standstill state of the vehicle. However, in California even if the vehicle is so-called "functioning properly" it will not pass smog if any emissions components are not equipped with an executive order number. The state of California enforces this because the state's set emissions cut-points are held at much higher standards than most other states. Therefore, if a part is not CARB approved there is a high chance that it leads to more than ideal emissions particles being emitted by the vehicle. By adhering to CARB legal parts, consumers are helping reduce the pollution effects of their vehicles on the Earth.
Despite the state's efforts to reduce air pollution, tailpipe pollution continued to increase as of January 2019, increasing 5% since 2013. The government of California has set a target goal of 5 million electric vehicles by 2030, but even if California is successful in meeting this goal, they won't meet their carbon reduction goal without at least a 25% reduction in per capita miles travels. Because of the layout of California's sprawling cities, the state is not well suited for public transportation and this continues to affect California's ability to meet its targets for carbon reduction.
Greenhouse gas emissions are a grave danger to Californians, as the presence of these pollutants is already felt throughout the state and is difficult to combat due to the massive number of cars being driven daily. As mentioned, Los Angeles is especially vulnerable to this issue because commute by vehicle is the principal form of transportation in the city, so the emissions from cars will only continue to fill the thick, stagnant air until better solutions are implemented. As of now, two of these goals are to reduce emissions by 40% by the year 2030, and to continue searching for renewable resources, such as electricity. While ambitious, these goals are working toward a crucial goal: reduce emissions by removing a portion of the source of the problem.
Air pollution due to the aforementioned sources serve to exacerbate the effects of climate change, which causes forest fire activity to increase as the climate along the west coast of the United States becomes hotter and drier. A 2016 study concluded that fuel aridity, which indicates how favorable forest vegetation is towards igniting and starting fires, increased significantly over the years 1979-2015, and that dry, hot, fire-weather seasons increased on average by 41% over this same time frame. The study also concluded that about 55% of the increase in both fuel aridity and the length of fire seasons on the west coast was due to human activity alone. As forests burn, they also release greenhouse gases into the atmosphere, continuing to reinforce climate change and local warming in a positive feedback loop, as well as directly causing health problems to people living nearby that may breathe the smoke. During the summer of 2021, significant amounts of land were reported to be burned, which included a fire that spanned nearly a million acres—the largest in California's history. This was a contributor to the 75 million metric tons of CO2 released by wildfires from June to August 2021, according to the Copernicus Atmospheric Monitoring Service. Wildfires specifically are one of the main sources of fine particulate matter smaller than 2.5 mm in diameter (PM2.5), and it is projected that by 2051 there will be 1.6 times more PM2.5 in the air over the west coast due to wildfires compared to today, with smoke levels being significantly higher in sections of Central to Northern California during fire seasons.
On an economic level, damages from wildfires can have significant socioeconomic costs, both on a direct and indirect level. A study analyzing the economic impact of the 2018 California wildfires found that almost 150 billion dollars were spent on wildfire damages (about 1.5% of its annual GDP), 59% of which consisted of indirect losses (i.e. disrupted supply chains) both in- and out-of-state. Preventative expenditures are also costly, and among all western states California has the highest wildfire suppression costs by far, totaling over $890 million between 2005 and 2015. Concern for the state's increased susceptibility to wildfires has also increasingly led to a push for legislatures regarding wildfire prevention and mitigation funding. For example, in 2021 Initiative Statue 21-0037 was proposed, which allocates funds towards training firefighters, strengthening wildfire monitoring systems, and improving infrastructure in areas that are vulnerable to fire.
The U.S. Environmental Protection Agency's interactive online map - EJSCREEN - features the low socioeconomic communities across the country that are more vulnerable to air pollution and its associated health risks. As exhibited in this map, Southeast Los Angeles County neighborhoods, primarily impoverished areas in the San Joaquin Valley and Inland Empire, face a higher exposure to air pollution and environmental injustices. In such areas, those in poverty-stricken areas have unequal access to environmental health and safety resources. These poverty-stricken neighborhoods are frequently located in areas that are near freeways, hazardous facilities, and/or rail yards.
In 2017, researchers found that diabetes in Latino and Latina children living in Los Angeles is linked to air quality. A study led by the University of Southern California was the first of its kind to follow the health and residential air pollution levels of the same children over a span of several years. The subjects of the study were overweight Latino children, between the ages of eight and fifteen, residing in areas with excess particulate matter. In particular, the neighborhoods of the children were located in areas of elevated nitrogen dioxide levels, an air pollutant caused nearby power plants and high-volume vehicle traffic. The results demonstrated that the children possessed significantly increased risk factors for Type 2 diabetes by the time they turned eighteen, such as diminished efficiency in the insulin-secreting cells of the pancreas. The insulin resistance that results from such a condition is a direct cause of diabetes onset.
Diabetes mellitus is a disease that is characterized by the body's inability to properly regulate blood glucose (or blood sugar) levels. Prolonged levels of high blood sugar may lead to severe health complications such as heart disease, nerve damage, kidney failure, blindness, or even early death. As diabetes becomes a rising epidemic, the Center for Disease Control and Prevention estimates that up to nearly 8 million U.S. citizens may have undiagnosed diabetes or its precursor. Conventional medical findings suggest that unhealthy or calorie-dense diets, lack of physical activity, and family history are risk factors for developing the disease; however, recent studies are beginning to trace a connection between Type 2 diabetes and the external factor of air pollution. Because socioeconomic status, race, and exposure to air pollution are frequently correlated, the CDC acknowledges certain socioeconomic conditions or races as pre-existing risk factors for Type 2 diabetes, in addition to those previously listed. Statistics suggest that Hispanic people are 50% more likely to die from diabetes than whites, and studies focusing on issues of environmental injustice are able to demonstrate possible reasons for this disparity.
The spatial arrangement of Californian communities plays a large role in determining exposure to the concentrated air pollution of the state's southern regions. In one suburb of Los Angeles, El Marino Language School sits adjacent to the ten-lane Interstate 405. Students of schools like these, often elementary-aged, are subject to dramatically increased levels of pollution from automobile emissions, including carcinogenic compounds. Health effects of traffic pollution include the onset of cardiovascular disease, asthma, impaired lung function, premature death, and a plethora of other complications. Furthermore, the incomplete development of children's sensitive respiratory systems leads to compounded effects of air pollution when compared with the health effects of the same pollution on adults.
Though the health consequences of vehicle pollution are widely recognized and some legislation has been enacted to reduce its impact, very little tangible action has actually been taken. In 2003, California passed Senate Bill No. 352, which banned the construction of new schools within 500 feet of freeways with certain exceptions. However, the bill remained largely ignored as 1 in 5 schools opened between 2014 and 2015 were still in direct violation of the ban. In 2015, the Environmental Protection Agency released a report titled "Best Practices for Reducing Near-Road Pollution Exposure at Schools", available both online and in-print. However, without any requirements regarding school siting from the U.S. Department of Education, state-funded schools are under no obligation to follow its guidelines. The reluctance of public schools to comply with safety regulations often stems from monetary limitations that encourage the use of cheap land, a dilemma that disproportionately impacts children of poorer areas; the report noted that minority and low-income students have a higher prevalence of attendance in public schools of urban areas, such as the big cities in which busy roads and schools share territory.
Oil fracking is a process that involves a high-pressure injection of fluid into the ground to extract oil. The adverse environmental effects of this oil and natural gas extraction are the subject of much controversy, the primary concerns of which surround the contamination of surrounding water and air sources. These risks result when underground drinking water and surface water are exposed to discharges of the chemically infused fracking fluid due to faulty construction or operation, disposal leaks, or other unintended byproducts like the release of hazardous volatile compounds into the air. In terms of air pollution, "hydrofracking" causes detriment to both the environment and human health. Enormous quantities of methane, a greenhouse gas, escape into the ozone layer of Earth's atmosphere during the extraction process, where they accelerate the impacts of climate change. Furthermore, air contaminants like nitrogen oxides, carbon monoxide, formaldehydes, and hydrogen sulfide that are released during drilling have been shown to cause harmful effects ranging from cancer, organ failure, neurological issues, to birth defects.
In 2015, a study revealed that there are forty-five fracking sites within 1.5 miles of one junior high in the town of Shafter, one of California's top ten most polluted communities. The students of this community suffer from the state's decision to allow oil companies to continue hydraulic fracturing within close proximity of their schools. Parents observe severe and unexplainable health complications amongst their children, including asthma and epilepsy, that may be correlated with air toxins from the nearby wells. In all of Kern County, in which Shafter is located, a staggering ten school districts sit within one mile of fracking wells. The situation becomes even more problematic when the fact that Kern County is predominantly Latino in racial/ethnic composition is considered; in fact, 20% or more of its residents are foreign-born emigrants of Asia and Latin America. Some argue that the concentration of fracking sites around the community's population of color is a discriminatory practice in direct violation of California Code 11135, which states that no person shall be unlawfully subjected to discrimination by any state or state-funded agency on the basis of race or ethnic group identification.
In 2012, this research used the method of cumulative environmental hazard inequality Index (CEHII), which is a model developed to environmental inequality in air pollution hazards., to analyze the environmental inequality in three counties in California: Alameda, San Diego and Los Angeles (Jason et al. 2012). In addition to frequently used air pollution parameter like NO2, PM 2.5 and diesel PM, a metric of heat stress was included for the analysis because excessive heat weather comes to be an environmental problem that can threaten human health.
The result indicated that colored communities bear greater air pollution including NO2, PM 2.5, PM 10, and heat stress compared to predominantly white and more affluent communities. In San Diego County, the relative heat stress inequality was founded to be the highest. Also, significant heat stress inequality was observed in Los Angeles. The result shows that in these two counties, there was a strong positive correlation between the percentage of Non-Whites in the community and heat stress inequality. However, in Alameda county, an opposite pattern was found: the community with a higher White population experienced more extreme temperature exceedances. This might be explained by the fact that the White population and the more affluent class in Alameda County mainly lived in the eastern area further away from the coast, which resulted in the higher heat stress exposure.
Also, the research verified that poverty status is consistent with the trend of disproportion burden of the racial-ethnic status. As the analysis was conducted according to the poverty status instead of racial-ethnic status for air pollutants NO2, PM2.5, and diesel PM, the results indicated a similar result as the analysis to heat stress. Furthermore, from the data, a strong correlation was found between poverty and proportion of non-white population (Alameda: r=0.69, Los Angeles: r=0.77). Above all, this research demonstrates that air pollution is disproportionately distributed according to the socioeconomic and racial-ethnic status in the United States.
As a future direction of study, it plans to classify the inequality that exists in African American, Hispanic, Asian, and other ethnic groups. Furthermore, the technique used in this research provided a way to assess environmental inequality and the results can be used to assist decision makers in efforts to address environmental inequality issues.
In February 2016, the city of Oakland publicly announced construction plans for the Oakland Bulk and Oversized Terminal, a bulk exporting facility in West Oakland. As a predominantly Latino and African-American community, the residents of West Oakland live in a community that suffers from dangerous levels of air pollution. The construction of this port and its proposed partnership with Utah's coal-mining counties would rank the city as the lead coal exporter on the West Coast. To fund such a goliath project in the face of strong resistance from city councils fighting to protect their local communities from drastically increasing pollution emissions, Utah state and county officials arranged a controversial $53 million loan. The fund, composed of taxpayer dollars intended for local projects, would allow for the annual shipping of 9 million tons of coal through Oakland and an increase in national coal exports by 19%. A movement by environmental advocates quickly grew, citing that exposure to toxic coal dust would also subject the city's residents to increased risks of bronchitis, pneumonia, heart disease, emphysema, and more.
In response, thousands of Oakland residents and environmental rights activists worked together to prevent the construction of the coal terminal at the former Oakland Army Base. In July 2016, Oakland City Council voted to ban coal from being handled and stored in the City of Oakland. The decision marked a large victory for the newly established Department of Race and Equity, an organization designed to protect Oakland's predominantly African-American community from social and racial disparities. According to the "Toxic Wastes and Race in the United States" report issued by the East Bay Community Foundation, those living in West Oakland already encounter five times more toxic pollution per person than residents of the city of Oakland, and children living in West Oakland are seven times more likely to be hospitalized for asthma than the average child in California. The residents of West Oakland are more likely to face both decreased life expectancy and asthma-related emergency room visits. For a city already bearing a disproportionate amount of environmental burdens, the fight for a coal-free Oakland was a success for proponents of environmental justice.
Air pollution stems from a number of sources, and the amount of pollutant from each source differs from place to place. Particulate pollution sources are shown in the graph at right. Residential wood combustion, such as burning wood in fireplaces, is the largest source of PM 2.5 pollution.
The Clean Air Act requires the US EPA to regulate six common pollutants. These air pollutants (also known as "criteria pollutants") are found all over the United States. They are particle pollution, ground-level ozone, carbon monoxide, sulfur oxides, nitrogen oxides, and lead. All of these pollutants have been shown to have adverse health and environmental impacts and some can cause property damage. Of the six pollutants, particle pollution and ground-level ozone are the most widespread health threats. EPA calls these pollutants "criteria" air pollutants because it regulates them by developing human health-based and/or environmentally-based criteria (science-based guidelines) for setting permissible levels.
Fossil fuels are a leading source of air and water pollution in the United States. The Clean Air Act estimated the economic cost of air pollution to be $9 trillion between 1970 and 2000. These costs involve pollution-induced health effects and lost productivity. Additionally, global warming is predicted to inflict a variety of other costs, and with declining rainfalls and rising temperatures, global warming can increase the formation of ozone smog and worsen pollution.
Land pollution is principally caused by thoughtless or illegal disposal of wastewaters or solids containing pollutants. Dumping garbage, and littering on the ground, although unsightly, rarely cause much lasting damage unless the material contains non-degradable materials such as many plastics or is at risk of entering a watercourse and thus eventually reaching the sea. Furthermore, a study found that soil emissions, particularly agricultural soils, help contribute a significant amount of nitrogen oxide ( NOx for short) to the atmosphere. The study found that biogenic NOx emissions will continue to increase in the coming years as the agriculture sector struggles to meet the increase in food demand, and with the frequent climate changes that are occurring in California every year such as pronounced heat waves and drought, these factors will help exacerbate biogenic NOx emissions.
Studies have proven there are several negative health outcomes associated with breathing polluted air. Studies have found that some pollutants have damaging effects on humans, especially during pregnancy. More specifically, results from several epidemiological studies suggest that exposure of pregnant women to air pollution results in higher risks of low birth weight in term-born infants. The California Birth Defects Monitoring program measured the amount of carbon monoxide, nitrogen dioxide, ozone, and particulate matter <10 μm in aerodynamic diameter and found that continued exposure to carbon monoxide led to increased cardiac ventricular septal defects, aortic artery and valve defects, pulmonary artery and valve anomalies, and an increase in conotruncal defects. Studies done on humans exposed to pollutants, one of them being polychlorinated biphenyls, which causes decreased birth size, increased sexual development, and altered levels of hormones related to gland regulation. A study conducted by University of California Los Angeles linked ambient air pollution to premature births. The study found that the odds of preterm birth increased consistently with continued or increasing carbon monoxide exposures and exposure to particulate matter less than or equal to 2.5 μm in diameter. The study also found women who were exposed to carbon monoxide above 0.91 ppm during the last 6 weeks of pregnancy experienced and increase in the odds of preterm birth.
Many studies examine the effect of children's health. Some of the findings show that children's lung function growth is adversely affected by air pollution, high levels of air pollution is associated with increased number of asthma cases or asthma exacerbations in children, and school absences from acute respiratory illnesses resulted following rises in ozone levels in student communities. Additionally, numerous problems have been found by the CA Department of Health Services in classrooms at several hundred schools throughout California such as inadequate ventilation, poor thermal comfort, high formaldehyde levels, and toxic residues in floor dust.
Long-term exposure to particulate air pollution is associated with mortality from heart disease and stroke. Particulate matter < 2.5 μm in diameter (PM2.5) has been associated with multiple mortality categories, especially in the category of cardiovascular death. Combustion-associated pollutants (such as vehicle emissions) have also been linked to the increase in mortality rates. For example, for a 3-day lag, the latter increased by 1.6, 2.1, 1.6, and 1.5% for PM2.5, EC, OC, and nitrates based on interquartile ranges of 14.6, 0.8, 4.6, and 5.5 μg/m3, respectively. An association between mortality and PM2.5 were higher during the cooler months. Affected populations can develop a higher risk for lung cancer and other cardio vascular diseases by breathing in polluted air.
There are also economic repercussions from the effects of pollution in California. One study suggests the health-related impacts of air pollution in San Joaquin Valley drains the region's economy of $3 billion every year. The study calculates the cost of pollution in Central Valley averages $1,000 per person per year, representing the costs of premature deaths, asthma attacks, acute bronchitis in children, school absences, lost work days, etc.
The Gold Rush of California left a long-lasting mark of pollution in the River systems of California. Northern California Gold mine runoff largely contributes to the elevated levels of mercury found in the river systems, such as, the Sacramento River. The mining of mercury along coastal ranges and its use in processing gold in the Sierra Nevada area is the reason for increased levels of this heavy metal. As mercury travels down the California River system it gets deposited along the river and buried under or with other sediment. Due to the burying of this heavy metal, increases in mercury in the actual river water can be seen during peak storm flow when the water is capable of holding more sediment due to its increased capacity and speed. The mercury gets unburied and reintroduced into the flow of the river water. One of the problems that arise from having mercury in the California river system is bio accumulation. As fish are exposed to mercury in the river system it begins to accumulate in their tissues. When another organism eats a contaminated fish, they ingest the mercury that was in the fish, which then accumulates in their tissues. This causes a risk to human health as fisherman or hunters catch these fish, or predators of these fish, which then passes the mercury on to the human consumers.
Before true water quality regulations began in the 1960s and 70's, California largely dumped their waste, such as, raw sewage, into bodies of water legally. Billions of gallons of sewage, treatable waste water and storm drain water were dumped into California streams around the 1940s. It wasn't until around 1945 that the problem of water pollution in California began to be truly noticed. 13 water wells tested positive for phenolic waste in the Montebello District. The beginning attempts at water regulations began at this point, especially when it was realized that this quality of water was not an isolated incident rather it was common across the entire state.
The use of leaded gasoline up until 1992, when it was phased out, caused a large amount of lead to be introduced into the California water systems. 90% of the lead emitted in California is from leaded gasoline which is higher than the total global emissions from leaded gasoline. The reason it is greater in California is due to the high use of cars in California. The amount of lead in the water system is similar to mercury in that its concentration in the water increases during peak flows. The overall amount of lead recorded in the California water system has been declining over the past few decades.
California waste water treatment plants release large amounts of N (Nitrogen) in the form of NH4+ (Ammonium). This has been shown to reduce naturally occurring spring and summer phytoplankton blooms. These creatures make up the primary source of food. With the lack of dependable Phytoplankton blooms a bottom-up effect occurs. Decreased biodiversity and overall number of species located in the water of California over time can be seen due to the large amounts of NH4+. The main source of this NH4+ can be traced to the Sacramento Regional Water Treatment Plant (SRWTP). SRWTP releases 90% of the NH4+ seen in the San Francisco Estuary (SFE)
Water quality regulations started in the 1960s and 1970s with the passage of the California's Porter-Cologne Water Quality Control Act and the federal Clean Water and Safe Drinking Water Acts, which prevent discharges of pollution into water bodies and control the quality of water that comes out of the tap. Pollution in water systems occurs when toxic substances enter water systems such as lakes, rivers, and oceans and cause degradation.
California is faced with several water pollution issues that are unique to the state. For example, it has suffered a severe drought for many years, and researchers claim this could be a major reason for the poor water quality observed in many parts of California today. The heat and low flows of water lead to stagnant, toxic bodies of water that are warm in temperature and low in oxygen. Along with an increase in salinity in the water, these complications pose a serious threat to the marine life. However, the issue of water pollution in California is not limited to rivers and the ocean. Some counties are notorious for having toxic chemicals found in their water supply. Many counties use groundwater reserves as drinking water, which is often filled with toxins, such as nitrate. This problem is a particular hazard in the San Joaquin Valley, where 63% of California's nitrate-infested water supplies reside. Arsenic, uranium, and fluoride are also commonly found in Californian wells, posing a direct threat to public health.One reporter even recalled a story in which he stopped on the side of the road to examine the foul-smelling pools of water that were steaming from the oil toxicity. In 2015, an oil spill occurred off the coast of Santa Barbara, sending 105,000 gallons of crude oil into the Pacific Ocean and killing thousands of animals and surrounding wildlife. The Santa Barbara oil spill of 1969 caused 3 million gallons of oil to spill into the ocean. This was the largest oil spill in United States history for many years and gained national attention as images of dead animals washing ashore flooded the media.
The issue of ocean pollution does not only affect California's Pacific coast, it is an international issue. According to the National Oceanic and Atmospheric Administration, there is no place on Earth that has been left untouched by marine debris. Marine debris is anything man-made that ends up in marine environments. Some of the most common items that end up as debris are plastics, abandoned vessels, and fishing gear. Of the marine debris, approximately 80% originates from land, the other percentage comes from sea disposal. The North Pacific Subtropical Gyre (NPSG) commonly referred to as the ‘Great Pacific garbage patch’ is a result of the marine debris accumulating.
While access to plastic has increased the amount of plastic in marine environments reciprocates. These plastic products in marine environments degrade slowly, remaining floating for an extended amount of time or sink to the bottom where they can remain for up to several decades. The threats posed by the plastic in the ocean and other bodies if water includes animals becoming entangled leading to drowning, ingestion which can lead to digestive and feeding issues. The issue of ocean pollution affects marine wildlife, human health and California's tourist economy. The litter other than becoming an eyesore to California's beaches can also negatively affect coastal communities economy.
To help combat the plastic flowing into the Pacific Ocean, The Ocean Cleanup organization announced they would deploy an Interceptor Original, one of their solar-powered, automated systems, near the mouth of the Ballona Creek in southwestern Los Angeles County in 2022.
- Central Valley groundwater pollution
- Climate change in California
- Environmental impact of shipping
- Pollution in Long Beach, California
Government response:
- California Air Resources Board
- California Environmental Protection Agency
- Global Warming Solutions Act of 2006
- List of Superfund sites in California
- BurningIssues/Clean Air Revival An educational California site on air pollution
- Breathe California
- AirNow live air quality index for California Displays map and table of AQI for all major California cities
Open spaces[edit | edit source]
Ulistac Natural Area[edit | edit source]
- Ulistac Natural Area, the only dedicated natural open space in the City of Santa Clara. UNA's 40 acres of undeveloped land along the Guadalupe River, not far from the largest nearby city, San Jose, is a tiny oasis of natural beauty in a giant suburban desert. It's also a work in progress as UNA and its many volunteers attempt to return the tract to pre-colonial condition. The Ohlone, various indigenous peoples, tended the land in the area for up to 3,000 years before European colonization. The name of the preserve is derived from their language. It refers to one past use of the area — a place to weave baskets. "A paradise made even more bountiful by the Ohlone's land management practices." An unrestrained river fed fertile bottom land. Herds of tule elk, pronghorn, and mule deer roamed the grasslands and forests. Streams teemed with salmon, perch, and stickleback. Waterfowl were plentiful and a key Ohlone food source. As is the case today, man and beast enjoyed one of the most hospitable climates on the continent.[6]added 22:10, 1 December 2020 (UTC)
Other initiatives[edit | edit source]
- Greenbelt Alliance
- Pogo Park, Bay Area
Trees, woodland and forest[edit | edit source]
Monterey County reforestation[edit | edit source]
The Monterey County reforestation refers to efforts in Monterey County, California, to preserve the county's pine forests and urban environment. This one county boasts the native Monterey Pine ecosystem; one of the rarest forest ecosystems in the world. Only a few thousand acres of these endemic trees exist in four locations along the Pacific Ocean on the Central Coast of California. The city of Monterey itself maintains more than 19,000 trees in parks and along streets, as well as about 300 acres (1.2 km2) of Monterey Pine forests.
Other initiatives[edit | edit source]
Forested mountains[edit | edit source]
The ecology of California can be understood by dividing the state into a number of ecoregions, which contain distinct ecological communities of plants and animals in a contiguous region. The ecoregions of California can be grouped into four major groups: desert ecoregions (such as the Mojave Desert), Mediterranean ecoregions (such as the Central Valley), forested mountains (such as the Sierra Nevada), and coastal forests.
Different authorities define the boundaries of ecoregions somewhat differently: this article follows the definitions of the World Wide Fund for Nature (WWF) and the United States Environmental Protection Agency (EPA)
California's high mountains block most moisture from reaching the eastern parts of the state, which are home to California's desert and xeric shrub ecoregions. The low desert of southeastern California is part of the Sonoran desert ecoregion, which extends into Arizona and parts of northern Mexico. California has two high deserts: the Mojave desert and the Great Basin Desert. The Mojave desert ecoregion is marked by the presence of Joshua trees. The dry cold Great Basin desert of California consists of the Owens Valley, and is classified into Great Basin shrub steppe by the WWF, and into the Central Basin and Range ecoregion by the EPA.
The deserts in California receive between 2 and 10 inches (51 and 254 mm) of rain per year. Plants in these deserts are brush and scrub, adapted to the low rainfall. Common plant species include creosote bush, blackbrush, greasewood, saltbush, big sagebrush, low sagebrush, and shadscale. Higher elevations have more precipitation, which allows drought-resistant trees to grow, such as western juniper and pinyon pine.
The coast of California from Monterey Bay south to the Mexican border, and inland from San Francisco Bay Area to the Sierra Nevada foothills contain California's Mediterranean ecoregions. This region is divided by the WWF into three California chaparral and woodlands ecoregions, plus the Central Valley grasslands. The EPA divides the region between the Central Valley (ecoregion 7), the Southern California chaparral (ecoregion 6), the Southern California mountains (ecoregion 8), and the Southern California coast (ecoregion 85).
The WWF distinguishes between different chaparral ecoregions based on species endemism. In the south, the California coastal sage and chaparral extends across the Mexican border into northwestern Baja California and Los Angeles. The coastal sage ecoregion is notable for having the highest number of native bees in the United States, although much of the ecoregion is now urbanized. The California montane chaparral and woodlands include the Transverse Ranges north of Los Angeles as well as the Santa Lucia Range on the Central Coast. The montane chaparral consists of a mosaic of sage scrub, chaparral, and montane species, depending on altitude. The California interior chaparral and woodlands form a ring around the Central Valley, covering the hills around the Bay Area as well as the foothills of the Sierra Nevada. The interior woodland ecoregion contains several endemic species, due to unique soil types such as serpentine.
These chaparral ecoregions contain numerous plant communities, including oak savanna, oak woodland, conifer woodlands, chamise chaparral, coastal sage scrub, and coastal grassland. These plant communities often occur as a mosaic, caused by fire.
California's Central Valley was once a large temperate grassland containing native bunchgrasses and vernal pools. Grizzly bear, gray wolf, tule elk, and pronghorn antelope used to inhabit the grasslands. The native grasslands and pools have now been largely replaced by livestock ranches and farms. The Carrizo Plain, where the native grass is preserved, is referred to as the "Serengeti of California".
The cooler and wetter mountains of northern California are covered by forest ecoregions. Both the WWF and the EPA divide the mountains into three ecoregions: the Sierra Nevada, the Klamath Mountains, and the Eastern Cascades Slopes and Foothills (occurring on the Modoc Plateau).
The Sierra Nevada are home to half of the vascular plant species of California, with 400 species that are endemic to the region. Like many mountain ranges, the plant communities of the Sierra group into biotic zones by altitude, because of the increasingly harsh climate as elevation increases. These biotic zones include montane forest dominated by conifers such as Jeffrey pine and Lodgepole pine, subalpine forest dominated by whitebark pine, up to alpine tundra which cannot support trees. The Sierra are also notable for giant sequoia trees: the most massive on earth.
The Klamath and Siskiyou Mountains are a notable biodiversity hotspot, containing one of the four most biodiverse temperate forests in the world. The diversity is caused by the ecoregion being adjacent to a number of other ecoregions, diverse soil, and having refugia caused by isolation in the last ice age. Some endemic species in the Klamath mountains are limited to only one mountain or valley.
The Eastern Cascades slopes of the Modoc Plateau are characterized by a mosaic of open ponderosa pine forest, grasslands, and shrublands. Although high, these slopes and mountains are in the rain shadow of the Cascade Range, and hence are drier and more open.
The coast of California north of San Francisco contains the Northern California coastal forests (as defined by the WWF) and the southern section of the Coast Range ecoregion (as defined by the EPA). This ecoregion is dominated by redwood forest, containing the tallest and some of the oldest trees in the world.
The redwood forests thrive in a thin belt up to 35 miles (56 km) wide next to the coast, where the trees are kept moist by winter rains and summer fog. The redwood forests are also notable for having the highest forest productivity in the world.
Coastal forests[edit | edit source]
The ecology of California can be understood by dividing the state into a number of ecoregions, which contain distinct ecological communities of plants and animals in a contiguous region. The ecoregions of California can be grouped into four major groups: desert ecoregions (such as the Mojave Desert), Mediterranean ecoregions (such as the Central Valley), forested mountains (such as the Sierra Nevada), and coastal forests.
Different authorities define the boundaries of ecoregions somewhat differently: this article follows the definitions of the World Wide Fund for Nature (WWF) and the United States Environmental Protection Agency (EPA)
California's high mountains block most moisture from reaching the eastern parts of the state, which are home to California's desert and xeric shrub ecoregions. The low desert of southeastern California is part of the Sonoran desert ecoregion, which extends into Arizona and parts of northern Mexico. California has two high deserts: the Mojave desert and the Great Basin Desert. The Mojave desert ecoregion is marked by the presence of Joshua trees. The dry cold Great Basin desert of California consists of the Owens Valley, and is classified into Great Basin shrub steppe by the WWF, and into the Central Basin and Range ecoregion by the EPA.
The deserts in California receive between 2 and 10 inches (51 and 254 mm) of rain per year. Plants in these deserts are brush and scrub, adapted to the low rainfall. Common plant species include creosote bush, blackbrush, greasewood, saltbush, big sagebrush, low sagebrush, and shadscale. Higher elevations have more precipitation, which allows drought-resistant trees to grow, such as western juniper and pinyon pine.
The coast of California from Monterey Bay south to the Mexican border, and inland from San Francisco Bay Area to the Sierra Nevada foothills contain California's Mediterranean ecoregions. This region is divided by the WWF into three California chaparral and woodlands ecoregions, plus the Central Valley grasslands. The EPA divides the region between the Central Valley (ecoregion 7), the Southern California chaparral (ecoregion 6), the Southern California mountains (ecoregion 8), and the Southern California coast (ecoregion 85).
The WWF distinguishes between different chaparral ecoregions based on species endemism. In the south, the California coastal sage and chaparral extends across the Mexican border into northwestern Baja California and Los Angeles. The coastal sage ecoregion is notable for having the highest number of native bees in the United States, although much of the ecoregion is now urbanized. The California montane chaparral and woodlands include the Transverse Ranges north of Los Angeles as well as the Santa Lucia Range on the Central Coast. The montane chaparral consists of a mosaic of sage scrub, chaparral, and montane species, depending on altitude. The California interior chaparral and woodlands form a ring around the Central Valley, covering the hills around the Bay Area as well as the foothills of the Sierra Nevada. The interior woodland ecoregion contains several endemic species, due to unique soil types such as serpentine.
These chaparral ecoregions contain numerous plant communities, including oak savanna, oak woodland, conifer woodlands, chamise chaparral, coastal sage scrub, and coastal grassland. These plant communities often occur as a mosaic, caused by fire.
California's Central Valley was once a large temperate grassland containing native bunchgrasses and vernal pools. Grizzly bear, gray wolf, tule elk, and pronghorn antelope used to inhabit the grasslands. The native grasslands and pools have now been largely replaced by livestock ranches and farms. The Carrizo Plain, where the native grass is preserved, is referred to as the "Serengeti of California".
The cooler and wetter mountains of northern California are covered by forest ecoregions. Both the WWF and the EPA divide the mountains into three ecoregions: the Sierra Nevada, the Klamath Mountains, and the Eastern Cascades Slopes and Foothills (occurring on the Modoc Plateau).
The Sierra Nevada are home to half of the vascular plant species of California, with 400 species that are endemic to the region. Like many mountain ranges, the plant communities of the Sierra group into biotic zones by altitude, because of the increasingly harsh climate as elevation increases. These biotic zones include montane forest dominated by conifers such as Jeffrey pine and Lodgepole pine, subalpine forest dominated by whitebark pine, up to alpine tundra which cannot support trees. The Sierra are also notable for giant sequoia trees: the most massive on earth.
The Klamath and Siskiyou Mountains are a notable biodiversity hotspot, containing one of the four most biodiverse temperate forests in the world. The diversity is caused by the ecoregion being adjacent to a number of other ecoregions, diverse soil, and having refugia caused by isolation in the last ice age. Some endemic species in the Klamath mountains are limited to only one mountain or valley.
The Eastern Cascades slopes of the Modoc Plateau are characterized by a mosaic of open ponderosa pine forest, grasslands, and shrublands. Although high, these slopes and mountains are in the rain shadow of the Cascade Range, and hence are drier and more open.
The coast of California north of San Francisco contains the Northern California coastal forests (as defined by the WWF) and the southern section of the Coast Range ecoregion (as defined by the EPA). This ecoregion is dominated by redwood forest, containing the tallest and some of the oldest trees in the world.
The redwood forests thrive in a thin belt up to 35 miles (56 km) wide next to the coast, where the trees are kept moist by winter rains and summer fog. The redwood forests are also notable for having the highest forest productivity in the world.
News and comment[edit | edit source]
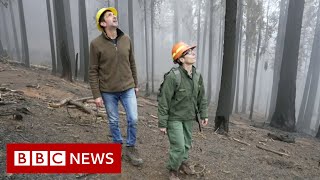
Urban and rural connections[edit | edit source]
section needed
Ecological emergency[edit | edit source]
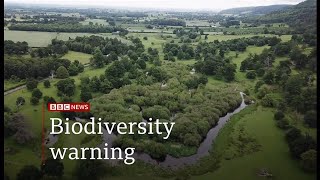

There is consensus in the scientific community that the current environmental degradation and destruction of many of Earth's biota are taking place on a "catastrophically short timescale". Scientists estimate that the current species extinction rate, or the rate of the Holocene extinction, is 1,000 to 10,000 times higher than the normal, background rate. Habitat loss is the leading cause of both species extinctions and ecosystem service decline. Two methods have been identified to slow the rate of species extinction and ecosystem service decline, they are the conservation of currently viable habitat and the restoration of degraded habitat. The commercial applications of ecological restoration have increased exponentially in recent years. In 2019, the United Nations General Assembly declared 2021–2030 the UN Decade on Ecosystem Restoration. W
UN Decade on Ecosystem Restoration[edit | edit source]

- Green Deal: pioneering proposals to restore Europe's nature by 2050 and halve pesticide use by 2030, ec.europa.eu (Jun 22, 2022)
The UN Decade on Ecosystem Restoration 2021-2030 is a rallying call for the protection and revival of ecosystems all around the world, for the benefit of people and nature. It aims to halt the degradation of ecosystems and restore them to achieve global goals. The United Nations General Assembly has proclaimed the UN Decade and it is led by the United Nations Environment Programme and the Food and Agriculture Organization of the United Nations. The UN Decade is building a strong, broad-based global movement to ramp up restoration and put the world on track for a sustainable future. That will include building political momentum for restoration as well as thousands of initiatives on the ground.[7]
The decade was conceived as a means of highlighting the need for greatly increased global cooperation to restore degraded and destroyed ecosystems, contributing to efforts to combat climate change and safeguard biodiversity, food security, and water supply. W
See also[edit | edit source]
- ↑ Press release, unep.org
- ↑ New Hampshire Department of Environmental Services- Coastal Program. Document number WMB-CP-06, 2004. “What is a Salt Marsh?” Weblink: http://web.archive.org/web/20070714015736/http://www.des.state.nh.us/factsheets/cp/cp-06.html
- ↑ Defenders of Wildlife © Copyright 2008. Webpage: Wildlife and Habitat. “Wetlands Factsheet.” Weblink: http://web.archive.org/web/20120226084631/http://www.defenders.org:80/wildlife_and_habitat/habitat/wetlands.php
- ↑ Wikipedia.com: Humboldt Bay http://en.wikipedia.org/wiki/Humboldt_Bay_(United_States)
- ↑ yesmagazine.org
- ↑ shareable.net, Neal Gorenflo, November 28, 2020
- ↑ Press release, unep.org