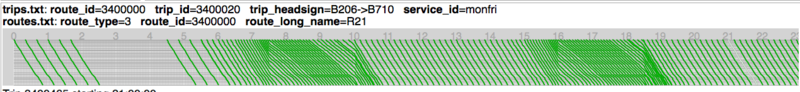
Size of this preview: 800 × 92 pixels. Other resolution: 1,270 × 146 pixels.
Original file (1,270 × 146 pixels, file size: 75 KB, MIME type: image/png)
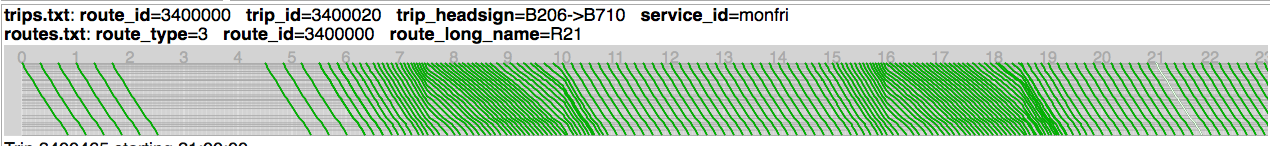
A time-distance graph of another bus timetable, with peak speed reductions applied, but with 'ramping' of the frequency specification applied to mitigate bunching and spreading observed by passengers throughout the network.
File history
Click on a date/time to view the file as it appeared at that time.
| Date/Time | Thumbnail | Dimensions | User | Comment | |
|---|---|---|---|---|---|
| current | 08:27, 11 April 2014 | 1,270 × 146 (75 KB) | PatSunter (talk | contribs) | A time-distance graph of another bus timetable, with peak speed reductions applied, but with 'ramping' of the frequency specification applied to mitigate bunching and spreading observed by passengers throughout the network. |
You cannot overwrite this file.
File usage
The following page uses this file: