Size of this preview: 800 × 400 pixels. Other resolution: 1,121 × 561 pixels.
Original file (1,121 × 561 pixels, file size: 290 KB, MIME type: image/png)
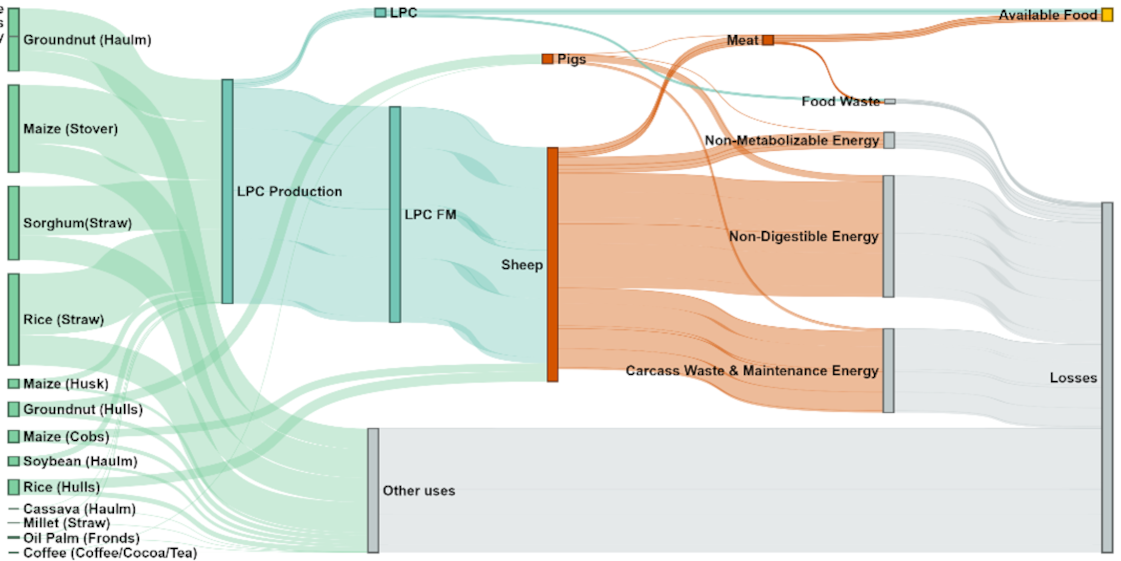
Energy flow diagrams for the four considered residue utilization cases. Diagrams represent energy flows per year. Improved utilization assuming pessimistic efficiencies.
File history
Click on a date/time to view the file as it appeared at that time.
| Date/Time | Thumbnail | Dimensions | User | Comment | |
|---|---|---|---|---|---|
| current | 13:14, 9 May 2023 | | 1,121 × 561 (290 KB) | J.M.Pearce (talk | contribs) | Uploaded own work with UploadWizard |
You cannot overwrite this file.
File usage
The following file is a duplicate of this file (more details):
- File:Graphabsblessing.png from Wikimedia Commons