

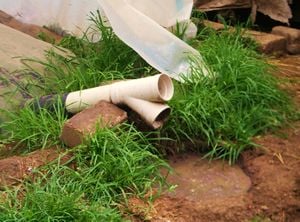
Testing biodigester effluent (or biol) is important in order to know how effective biodigesters work as a waste management solution for improving water quality. A lot of animal waste ends up untreated and in rivers causing problems of algal blooms, reduced oxygen availability for other living organisms like fish and plants, and can cause serious health issues in humans.
The following testing was conducted by the International Renewable Resources Institute and Biobolsa in order to test their biodidgester systems water quality and fertilizer applicability. This is part of a testing series for biodigester effluence the accompanying testing is on fertilizer quality of biodigesters.
Water Quality Expectations[edit | edit source]
These following expectations are for human waste water and these wastewater treatment systems usually include many components beyond just biodigesters.
Routine Effluent Monitoring and Expectations for Water Quality from Waste Water Treatment Systems
| Constituent | Units | Frequency | Typical Range | Limit for use in Agriculture Irrigation |
| Total Suspended Solids (TSS) | mg/L | Quarterly | 10 to 30 | |
| Biological Oxygen Demand (BOD) | mg/L | Quarterly | 5 to 15 *** | |
| Ammonia as Nitrogen | mg/L | Quarterly | < 3 | |
| Nitrate as Nitrogen | mg/L | Quarterly | 10 to 15 | < 30 |
| Total Kjedahl Nitrogen | mg/L | Quarterly | 10 to 15 | |
| Total Nitrogen | mg/L | Quarterly | 10 to 20 | |
| pH | Quarterly | 6-8 | ||
| Fecal Coliform | MPN/gTS * | During Release from Biodigester | Best if < 1001 Must be < 2,000,000 ** |
|
| Helminth Ova | ova/ 4g | During Release from Biodigester | < 1 ** |
Notes:
- Most Probable Number per gram of dry weight of Total Solids
- Fecal Coliform and Helminth eggs are both measured in dry solids based on biosolid standards. Biosolids are a by product of biodigesters in wastewater treatment. The problem with testing the dry solids is that the coliform and helminth egg number will be drastically reduced in comparison to the liquid state and our biodigester effluent application is in the liquid form.
- The effluent BOD samples should be treated with a nitrification inhibitor (TCMP) prior to performing the tests and the test results should be reported as CBOD to denote that an inhibitor was used.
- Fecal Coliform and Helminth eggs are both measured in dry solids based on biosolid standards. Biosolids are a by product of biodigesters in wastewater treatment. The problem with testing the dry solids is that the coliform and helminth egg number will be drastically reduced in comparison to the liquid state and our biodigester effluent application is in the liquid form.
- Most Probable Number per gram of dry weight of Total Solids
Total Suspended Solids (TSS)
TSS refers to the suspended or dissolved matter in water. Wastewater contains a variety of solid materials varying from trash pieces to colloidal material, however the effluent from animal waste biodigesters should be pretty uniform. Typical concentrations of TSS in untreated human domestic wastewater range from 120 mg/L to 400 mg/L. TSS expected in the final effluent from a treatment system should be in the range of 15 to 30 mg/L.[2]
Biochemical Oxygen Demand
Biochemical Oxygen Demand (BOD) is a measure of the rate at which organisms use oxygen while consuming decomposable organic matter present in water. Nitrates and phosphates contribute to higher BOD levels.[3] A higher BOD means the water contains a higher amount of available organic material and thus reduced oxygen availability.[4] Thus its very important to reduce the BOD in water entering rivers and open water bodies.
Nitrogen (N)
- is found in chlorophyll and protoplasm in plants and is an important component in proteins.
- Excess nitrogen shows as lush soft growth and can result in a significant yield loss through weakened stem and flattening of crop by wind and rain, failure to ripen, and increased susceptibility to pests and diseases.[5]
- Deficiency shows as a shortening of stems and yellowing of leaves.
- Plants that are high nitrogen feeders include: squash, cabbage, broccoli and corn.
- Most nitrogen in the world exists in our atmosphere as N2, which is not available to most plants for use, thus it is important to find and measure the amount of bioavailable nitrogen.[6]
Bioavailable Nitrogen
- Nitrate, NO3-
- Ammonium, NH4+
Nitrate, NO3-
- Nitrates are an important nutrient for plants. Crops such as tobacco, potatoes and tomatoes prefer nitrate as their source of Nitrogen. Nitrates are transformed from nitrites, NO2-, by nitrifying bacteria and Ammonia can be oxidized into nitrates or nitrites.[7] Fertilizers in nitrate form are susceptible to potential leaching and losses through gaseous emissions during
dentrification or nitrification.[8]
- In excess (at about 5 milligrams per liter) nitrates in lakes and streams can lead to excessive growth of alga, eutrophication, and thus a loss of dissolved oxygen. Reduced levels of dissolved oxygen can cause fish deaths as well as reduced growth of native plant vegetation.[9]
- Animals and humans cannot use inorganic forms of nitrogen and if nitrate does exceed 10 milligrams per liter in drinking water, it can cause interfere with blood-oxygen levels and lead to methemoglobinemia (or blue baby syndrome) in infants and gastric cancer.[10][11] *Leafy vegetables in particular, under different environmental condition's, can accumulate nitrates to potentially harmful concentrations. These vegetables include Brassicaceae (rocket, radish and mustard), Chenopodiaceae (beetroot, Swiss chard and spinach), Amaranthaceae (Amaranthus), Asteraceae (lettuce) and Apiaceae (celery and parsley).
The general limits of nitrates from leafy vegetables and drinking water is 100-170 mg/day of human consumption.[12]
- Summary: While reducing nitrate levels is an important factor in measuring effluent being returned to rivers and streams, having higher nitrate levels can be a benefit for fertilizer applications on crops as long as the nitrate levels in the fruits and veggies themselves remain below limits required for human consumption levels. This can mean that nitrate application is better for crops in their seedling and vegetative stage, while application should be reduced during the flowering and fruiting stage. Also their should be a crop specific application of nitrates, where leafy vegetables receive lower rates of nitrate application.
Nitrite, NO2
Nitrite is not bio available, but must be converted into nitrate for use by plants. Small concentrations of nitrite can be toxic to plants, but nitrite is an important intermediate in the conversion of ammonium to nitrate in the soil. Nitrite is also formed by dentrification, or the bacterial reduction of nitrate to nitrite, this occurs under anoxic (or oxygen deprived) conditions. Nitrite is not a stable intermediate and very few cases of nitrite accumulation have been reported. The levels of nitrite usually do not exceed 0.25 to 70 ppm within soil. Accumulation however can occur in neutral or alkaline soils, since the conversion from nitrite to nitrate is inhibited more than the conversion of ammonia to nitrite.[13] Also bacteria present in sewage sludge converts nitrates into nitrites.[14]
Ammonia, NH3
Ammonia is not bio available but must be converted into Ammonium for uptake by plants. This is very volatile and needs to be transformed into other forms of nitrogen like urea for storage. Ammonia is the pungent smell from composts with too much nitrogen and not enough carbon. Ammonia is also the form of nitrogen most commonly converted into synthetic nitrogen compounds, like nitric acid, for industrial fertilizer applications.
Ammonium, NH4+
Ammonium is just as available to plants as nitrate, however ammonium usually does not accumulate into the soil because it readily is converted to nitrate in most conditions.[15] Ammonium is less able to leach from the soil, however it is very volatile and can easily escape in aerobic environments.[16] Ammonium can be toxic in high enough concentrations and for this reason plants usually do not readily uptake this as readily as nitrate.
Organic nitrogen
- This is measured by the Total Organic Nitrogen, which does not account for inorganic forms of nitrogen like (NH4, NO3, NO2)
- Urea, (NH2)2CO, urea is an example of organic nitrogen and it is produced in the body principally for nitrogen excretion. Urea contains about 88 percent of the N (nitrogen), up to 67 percent of the P (phosphorus) and up to 71 percent of the K (potassium) present in human excreta.[17] When urea is applied to the soil it reacts with water to form ammonium within 2 to 3 days. If urea is soly applied to the surface of soil some volatilization of the ammonia will occur and this can be fairly drastic in summer months.[18]
Total Kjeldahl Nitrogen (TKN)
Total Kjeldahl Nitrogen is the sum of organic nitrogen, ammonia (NH3), and ammonium (NH4+).
Total Nitrogen
Total Nitrogen can be derived by finding total kjeldahl nitrogen (TKN), ammonia, and nitrate-nitrite and adding them together. Total Nitrogen does not include N2, which is not bioavailable.[19]
pH
pH is the concentration of hydrogen-ions in solution. The pH concentration suitable for the existence of most biological life is quite narrow and typically ranges from 6 to 9.[20]
Coliforms
Testing for coliform bacteria is cheaper and a lot faster than testing for specific organisms and pathogens, thus the U.S. Public Health Service created a standard in 1914 for coliform concentration as an indicator of overall microbiological suitability of drinking and surface waters. 1 fecal coliform/ 100ml = 1 ppb = 0.001 ppm.
Biol Testing for Water Quality[edit | edit source]
Expected Parameter Concentrations of Influent and Effluent Water Quality from Biodigester
| Parameter | Mean | Range |
| ph of influent[21] | 6.7 | 6.4-7.1 |
| 7.2 | 6.8-7.5 | |
| 35.6 | 22.4-45.0 | |
| 13.5 | 8.8-23.9 | |
| 62 | 2-79 | |
| E. Coli before loading[22] | 52,890 | 11,000-150,000 |
| 75 | 2-450 |
Testing COD in Biol
Common Range for Biol COD is 8.8 - 23.9 g/L.
Our hypothesis is that the Biol sample is at the high range of COD concentration common for biodigester effluent.
Cholorimeter can only test between 0-15 g/L on the high end. (These follow the instructions from the cholorimeter manual).
Thus we need at least a dilution of 6X.
Materials
- Reagent was out of digestive solution for COD
- Erlyn Meyer Flask
- funnel (made out of Pepsi bottle)
- 2 pipettes or droppers (one made from cleaned out microdyn bottle and the other was a plastic lab dropper)
- 3 jars
- gloves
- protective covering for table
- Digital Reactor Block (DRB)
- Cholorimeter
assumptions
- 001 ppm = 1 mg/L
1 drop =.05 ml
Process for Dilution
- Filled Erlyn Meyer flask to 150ml with sample biol
- Added 150 ml of garafon water to flask
- Mixed flask by swirling.
- Pored out mix down to 100ml
- Filled with garafon water back to 300ml. Resulting mix looks mostly uniform dark green with small amount of suspended particles.
Process for Adding Dilution to Reagent
- Ran COD program to preheat.
- Mix blank test without sample biol. Using a cleaned out microdyn bottle for adding 4 drops of garafon water to reagent test tube and labeled.
- Mixed second test tube with sample biol. Adding.20ml of sample biol (= to 4 drops) to reagent and labeled.
- Sealing test tube with biol sample and reagent and inverting 4 times.
- Once at 150 C and vials ready put vials in reactor block and pressed start.
- Wait 120 minutes for vials to be heated.
- Then allow to cool and Wait until it reaches room temperature.
- Wipe of vials of dust.
- Place vial of test tube blank in cholorometer and hit zero to calibrate the colorimeter to zero.
- Then take out the blank.
- Then wipe off vial with sample and place in the vial with the sample in the cholorimeter hit read and it will tell you the COD in mg/L. When calculating results for high range plus multiply the reading by ten.
Results
- Results 151mg/L (+/- 16 mg/L) X 10 (from cholorographer manual) X 6 (for dilution)= 9060 mg/l = 9.06 g/L.
9.06 g/L is very low COD, when the common range for Biol COD is 8.8 - 23.9 g/L.
Things Learned
- Next test make a graduated cylinder from spare cups, when low on lab gear.
- Using these cylinders make different dilutions including: 1:2, 1:4, 1:8, and using different biol samples. With up to 15 different reactor ports in the DRB for testing different samples and dilutions.
References[edit | edit source]
- ↑ Word, Tressie. PLANTAR UABJO:Plan de Operación & Mantenimiento. Universidad Autonómica de Benito Juárez, Oaxaca, México. August, 2010.
- ↑ Word, Tressie. PLANTAR UABJO:Plan de Operación & Mantenimiento. Universidad Autonómica de Benito Juárez, Oaxaca, México. August, 2010.
- ↑ Gary S. Thorpe. Barron's AP Environmental Science. Barron's Educational Series, 2009.
- ↑ Word, Tressie. PLANTAR UABJO:Plan de Operación & Mantenimiento. Universidad Autonómica de Benito Juárez, Oaxaca, México. August, 2010.
- ↑ Food and Agriculture Organization of the United Nations, FAO. Wastewater quality guidelines for agricultural use. http://www.fao.org/docrep/t0551e/t0551e04.htm#2.3 effluent quality guidelines for health protection
- ↑ Thomas Marler, Frank Cruz and James McConnell. Essential Plant Nutrients. College of Agriculture and Life Sciences, University of Guam
- ↑ E. I. UWAH*, J. ABAH, N. P. NDAHI and V. O. OGUGBUAJA. CONCENTRATION LEVELS OF NITRATE AND NITRITE IN SOILS AND SOME LEAFY VEGETABLES OBTAINED IN MAIDUGURI, NIGERIA. Journal of Applied Sciences in Environmental Sanitation. University of Maiduguri. August 2009.
- ↑ M.L. Vitosh, Extension Specialist. N-P-K FERTILIZERS. Michigan State University Agricultural Extension Bulletin. http://web.archive.org/web/20100612165241/http://www.canr.msu.edu/vanburen/e-896.htm.
- ↑ U.S. Geological Survey. USGS Water Quality Information. http://water.usgs.gov/owq/FAQ.htm
- ↑ U.S. Geological Survey. USGS Water Quality Information. http://water.usgs.gov/owq/FAQ.htm
- ↑ C Kameswara Rao. Toxicity of Nitrates and Nitrites in Plants. Foundation for Biotechnology Awareness and Education. Bangalore, India. July, 2007.
- ↑ E. I. UWAH*, J. ABAH, N. P. NDAHI and V. O. OGUGBUAJA. CONCENTRATION LEVELS OF NITRATE AND NITRITE IN SOILS AND SOME LEAFY VEGETABLES OBTAINED IN MAIDUGURI, NIGERIA. Journal of Applied Sciences in Environmental Sanitation. University of Maiduguri. August 2009.
- ↑ O. L. OKE. Nitrite Toxicity to Plants. Nature Vol. 212, 528. Oct. 29,1966.
- ↑ Mollison, Bill. Permaculture: A Designer's Manual. Tagari, 1988. Pg 576.
- ↑ Camberato, Jim and Nielsen, R.L. Soil Sampling for Assessing Plant Available N Following Excessive Rain or Flooding. Purdue University, Agronomy Department. West Lafayette, IN. June 2010. http://www.agry.purdue.edu/ext/corn/news/timeless/AssessAvailableN.html
- ↑ Graham Merrington. Agricultural pollution: environmental problems and practical solutions. Taylor & Francis, 2002.
- ↑ Drangert, JO. Fighting the Urine Blindness to Provide more Sanitation Options. Water SA. Vol 24, No 2. April, 1998. http://web.archive.org/web/20141222023233/http://www2.gtz.de:80/Dokumente/oe44/ecosan/en-fighting-urine-blindness-1998.pdf
- ↑ M.L. Vitosh, Extension Specialist. N-P-K FERTILIZERS. Michigan State University Agricultural Extension Bulletin. http://web.archive.org/web/20100612165241/http://www.canr.msu.edu/vanburen/e-896.htm.
- ↑ US Environmental Protection Agency. Total Nitrogen. Tribal Water Protection. http://www.epa.gov/region9/water/tribal/pdf/cwa-reporting/Total-Nitrogen.pdf.
- ↑ Word, Tressie. PLANTAR UABJO:Plan de Operación & Mantenimiento. Universidad Autonómica de Benito Juárez, Oaxaca, México. August, 2010.
- ↑ 21.0 21.1 21.2 21.3 21.4 Bui Xuan, An; Preston, TR; and Dolberg, F, 1996. The introduction of low-cost polyethylene tube biodigesters on small scale farms in Vietnam, Livestock Research for Rural Development, 8:1
- ↑ 22.0 22.1 Bui Xuan, An. The Role of Low-cost Plastic Tube Biodigesters in Integrated Farming Systems in Vietnam. Livestock Feed Resources within Integrated Farming Systems. pp. 277-294. http://www.fao.org/ag/againfo/resources/documents/frg/conf96pdf/an.pdf