PV economics: Methodology[edit | edit source]
Levelised Cost of Electricity (LCOE)[edit | edit source]
Levelised Energy Cost: "Levelized energy cost (LEC, also called Levelized Cost Of Energy or LCOE) is a cost of generating energy (usually electricity) for a particular system. It is an economic assessment of the cost of the energy-generating system including all the costs over its lifetime: initial investment, operations and maintenance, cost of fuel, cost of capital."
Also known as LUEC: Levelized Unit Energy Cost (LUEC) [1]
see also: Cost of Electricity by Source
Calculation Methods[edit | edit source]
Levelised Cost of Energy
It can be defined in a single formula as:

where
- LEC = Average lifetime levelized electricity generation cost
- It = Investment expenditures in the year t
- Mt = Operations and maintenance expenditures in the year t
- Ft = Fuel expenditures in the year t
- Et = Electricity generation in the year t
- r = Discount rate
- n = Life of the system
- W. Short, D. Packey, T. Holt, "A Manual for economic evaluation of Energy Efficiency and Renewable Energy Technologies", National Renewable Energy Laboratory- March 1995, pp1 -120, http://web.archive.org/web/20160303182003/http://www.nrel.gov/csp/troughnet/pdfs/5173.pdf
This manual is a guide for analyzing the economics of energy efficiency and renewable energy (EE)
PV LCOE Methodology to be used in the project[edit | edit source]
The LCOE methodology used in this project is adapted from the Branker's paper and LCOE Article.
link to the appropedia internal article on this.
The expressions for LCOE are given as below:


The total cost includes t=0 year since the installation costs during the first year are not discounted and there's no energy that will be lost. The aggregate costs include the initial payments, interests in case of debt financing, operational and maintenance costs. Government mandated incentives will not be considered here but they can also be included in this expression which will reduce the costs.
In the above expression, the energy generated in a given year (Et) is the rated energy output (St) multiplied by the degradation factor(1-d). The degradation factor reduces the energy output over a period of time. T is the life-span of the PV stand-alone system, It is the initial cost that includes installations, construction, and labor costs. Ot is the operation cost during the year t which is any year between 0 and T, Ft is the interest expenditure for the year t, r is the discount rate. The majority of the costs for PV stand-alone residential systems are upfront costs for installations which largely depends on the available financing schemes and the labor costs.
LCOE Calculations for Grid-Based Electricty[edit | edit source]
The utility structure for grid-based electricity is highly complicated and varies from utility-to-utility in all the states. For this paper, the utility data from four different states with different climatic conditions is collected from the appropriate sources. The LCOE of a grid based system is then calculated based on fixed charges, cost/kwhr, and taxes. The calculations are made using the excel spread-sheets to find the LCOE for grid consumers with different levels of energy consumption as a percentage of state-wide average consumption. The four different states chosen are Michigan, Florida, Arizona, and New York. These four states have same solar flux so it becomes easier to establish reasonable comparisons with the grid based technology. These four states also have very different climatic conditions from one another with Michigan being extremely cold with long winters and Arizona being very hot most part of the year. The LCOE for PV will compared with LCOE of grid with different levels of customers.
Example PV system Design[edit | edit source]
Simulation Input[edit | edit source]
The mathematical simulations for the calculations of the PV system's LCOE is performed in SAM tool. The type of simulation procedure used is PVWatts System model for LCOE calculations. The inputs to the model are Latitude of the location, analysis period, inflation rate, real discount rate, sales tax, ITC 30 % fixed, Degradation Rate, $/Wp cost of installation, DC-AC derate factor, tilt angle (latitude), azimuth =180, and nameplate capacity. Any kind of federal and state level incentives are ignored to maintain consistency at each level of simulation and at the same time that leads to close to realistic results.
| Catagory | Input Variable | Source | Notes |
|---|---|---|---|
| Climate | Weather Condition | from the NREL Solar Prospector website or the Energy Plus website | Depending on location |
| Climate | Solar Radiation | Depending on location | |
| PV System Design | Market option | Residential | |
| PV System Design | Configuration | Flat plate | |
| PV System Design | Layout | number of modules and inverters, array sizing | |
| PV System Design | Tracking and orientation | Fixed. Tilt depending on latitude | |
| PV System Design | Degradation and derating factors | Soiling, Pre-inverter Derates, Post-inverter Derates, Ground Reflectance | |
| PV System Design | Module Parameters | SAM database | Maximum power, maximum power voltage, maximum power current, e.g. |
| PV System Design | Inverter Parameters | Manufacturer' webpage | AC Voltage, Power ACo, Power DCo, PowerSo, e.g. |
| PV System Performance | System Degradation | Manufacturer' webpage | Compounded annually |
| Economic Environment | Incentives | Not considered in this project | |
| Utility Rate | Fixed Monthly Charges | OpenEI Online Utility Rate Database | Depending on utility's policy |
| Utility Rate | Rate Escalation | OpenEI Online Utility Rate Database | Depending on utility's policy |
| Utility Rate | Flat Rate | OpenEI Online Utility Rate Database | Depending on utility's policy |
| Utility Rate | Time of Use Rate | OpenEI Online Utility Rate Database | Depending on utility's policy |
| Utility Rate | Peak Demand Charges | OpenEI Online Utility Rate Database | Depending on utility's policy |
| Utility Rate | Time of Use Rate | OpenEI Online Utility Rate Database | Depending on utility's policy |
| Utility Rate | Tiered Rates | OpenEI Online Utility Rate Database | Depending on utility's policy |
| PV System Cost | Direct Cost | Manufacturer' webpage | Cost for PV system components, e.g. inverter, module, installation labor |
| PV System Cost | Indirect Cost | Land Cost | |
| PV System Cost | Indirect Cost | Operation and maintenance cost | |
| Financing | Analysis Period | 25~30 yrs | |
| Financing | Inflation Rate | ||
| Financing | Real Discount Rate | ||
| Financing | Taxes | Federal Tax, State Tax, Sale Tax | |
| Financing | Insurance | ||
| Financing | Residential Loan Parameters | ||
| Electrical Load | Residential Load | Classified |
Determination of tilt angle and cost/kW for full battery back-up[edit | edit source]
Each location has its unique latitude and longitude. Based on the geo-location of the area, the tilt angle for the solar panel will be determined. This tilt angle is an important parameter in the estimation of the size of battery back-up for the PV system. PVSyst tool will be used to verify the mathematically estimated size and cost of the full battery back-up.
Data Sources[edit | edit source]
Weather Data[edit | edit source]
- Energy Plus Weather Database
- Solar Prospector
- National Solar Radiation Data Base
- RETScreen Weather Database
Utilities Rates[edit | edit source]
PV Manufacturers[edit | edit source]
Software Tool[edit | edit source]
- System Advisor Model: SAM allows users to investigate the impact of variations in physical, cost, and financial parameters to better understand their impact on key figures of merit. Runs on TRNSYS engine.
- RETScreen: A decision support tool developed with the contribution of numerous experts from the Canadian government, industry, and academia. The software can be used worldwide to evaluate the energy production and savings, costs, emission reductions, financial viability and risk for various types of Renewable-energy and Energy-efficient Technologies (RETs).
Outcome of this project[edit | edit source]
Some of the key outcomes of this project are as follows:
- Pricing structure of grid-based technology does not promote energy conservation in most locations across US.
- In most cases, the consumers with lower level of consumption end up paying far more than the ones with higher level consumption in $/kwhr.
- The LCOE of PV systems is compared with the LCOE of grid for each level of consumer as a percentage of average energy consumption. A percentage of consumers that are already paying more than they should be paying is shown.
- The percentage of customers of all the customers within the state that can get off the grid based on current costs of PV is determined from the simulations.
- Sensitivity Analysis is performed on $/Wp cost of PV systems vs the LCOE which will be less than or equal to that of the grid electricity.
-
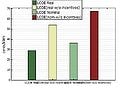
LOCE result from an example case provided by SAM
-
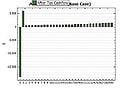
After Tax Cashflow result from an example case provided by SAM
-
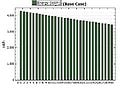
Annual Output result from an example case provided by SAM
-
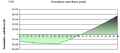
Cumulative cash flows graph from an example case provided by RETScreen


